Gus Van Velzen
All Matches, All Grades, Narara, 02-Nov-1935 to 15-Mar-2025
The Var is the variance of the scores to the mean. It is a measure of how reliable the batsman is at reaching their average. A low variance indicates the batsman will often get scores close to his average. A high variance indicates his scores are fairly unpredictable.
| Mat | Cts | ROs | Sts | GFs | GFWon |
|---|---|---|---|---|---|
| 33 | 16 | 2 | - | - | - |
Results by Season
| Season | Mat | Inn | NO | Runs | HS | Ave | SR | 100 | 50 | Overs | Maid | RunsA | Wkts | Ave | Best | 10W | 5WI | Cts | Sts | ROs |
|---|---|---|---|---|---|---|---|---|---|---|---|---|---|---|---|---|---|---|---|---|
| 1990/91 | 2 | 2 | - | 70 | 59 | 35.00 | - | - | 1 | - | - | - | - | - | - | - | - | - | - | - |
| 2007/08 | 11 | 8 | - | 93 | 31 | 11.62 | - | - | - | - | - | - | - | - | - | - | - | 4 | - | - |
| 2008/09 | 8 | 11 | - | 129 | 58 | 11.73 | - | - | 1 | 26 | 3 | 82 | 5 | 16.40 | 3-21 | - | - | 9 | - | 2 |
| 2009/10 | 12 | 13 | 2 | 242 | 59* | 22.00 | - | - | 1 | - | - | - | - | - | - | - | - | 3 | - | - |
Results by Grade
| Grade | Mat | Inn | NO | Runs | HS | Ave | SR | 100 | 50 | Overs | Maid | RunsA | Wkts | Ave | Best | 10W | 5WI | Cts | Sts | ROs |
|---|---|---|---|---|---|---|---|---|---|---|---|---|---|---|---|---|---|---|---|---|
| 1st Grade | 6 | 4 | 1 | 15 | 10 | 5.00 | - | - | - | - | - | - | - | - | - | - | - | 3 | - | - |
| 2nd Grade | 15 | 15 | 1 | 320 | 59* | 22.86 | - | - | 1 | - | - | - | - | - | - | - | - | 4 | - | - |
| 3rd Grade | 8 | 11 | - | 129 | 58 | 11.73 | - | - | 1 | 26 | 3 | 82 | 5 | 16.40 | 3-21 | - | - | 9 | - | 2 |
| 5th Grade | 2 | 2 | - | 70 | 59 | 35.00 | - | - | 1 | - | - | - | - | - | - | - | - | - | - | - |
| NSW Country Cup | 2 | 2 | - | - | - | - | - | - | - | - | - | - | - | - | - | - | - | - | - | - |
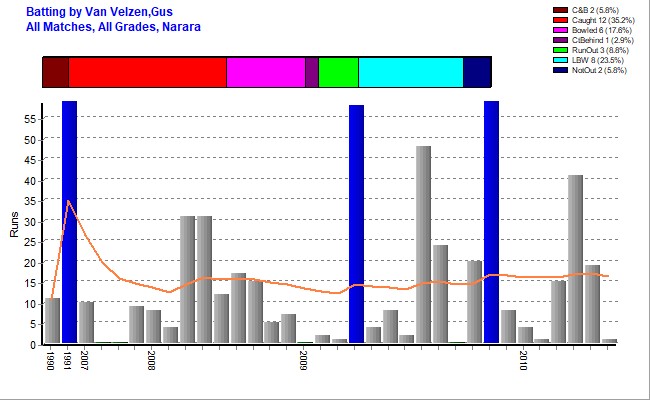
Batting Statistics
| Inns | NOs | Runs | HS | Ave | Var% | 50s | 100s | 4s | 6s | Ret |
|---|---|---|---|---|---|---|---|---|---|---|
| 34 | 2 | 534 | 59* Vs TMCC 2009/10 | 16.69 | 98.75% | 3 | - | 23 | 1 | - |
Batting Highlights
| Score/s | Team | Vs | Ground | Grade | Date |
|---|---|---|---|---|---|
| 59* | Narara 2nd | Terrigal-Matcham | Duffys Road | 2nd Grade | 14-Nov-2009 |
| 58{ct} | Narara 3rd | Toukley | Harry Moore | 3rd Grade | 14-Feb-2009 |
| 59{ct} | Narara 5th | Gosford | McEvoy | 5th Grade | 05-Jan-1991 |
Results by Batting Position
| Position | Inn | NO | Runs | HS | Ave | SR | 100 | 50 |
|---|---|---|---|---|---|---|---|---|
| Open | 6 | - | 76 | 59 | 12.67 | - | - | 1 |
| 3 | 6 | 1 | 177 | 59* | 35.40 | - | - | 1 |
| 4 | 11 | - | 171 | 58 | 15.55 | - | - | 1 |
| 5 | 4 | - | 11 | 8 | 2.75 | - | - | - |
| 6 | 2 | - | 40 | 31 | 20.00 | - | - | - |
| 7 | 2 | - | 48 | 48 | 24.00 | - | - | - |
| 8 | 2 | - | 10 | 10 | 5.00 | - | - | - |
| 9 | 1 | 1 | 1 | 1* | - | - | - | - |
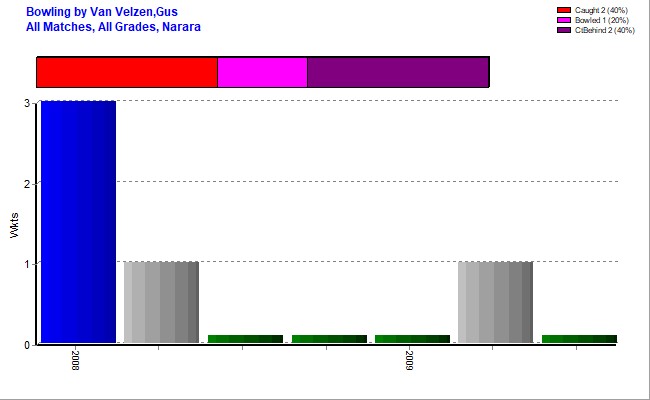
Bowling Statistics
| Overs | Maids | RunsA | Wkts | Best | Ave | 5WI | 10WM | Econ | SR |
|---|---|---|---|---|---|---|---|---|---|
| 26 | 3 | 82 | 5 | 3-21 Vs KCC 2008/09 | 16.40 | - | - | 3.15 | 31.20 |
First Match
| Batting | Bowling | Team | Vs | Ground | Date |
|---|---|---|---|---|---|
| 11{ct},dnb | Narara 5th | Lisarow | Kurraba | 15-Dec-1990 |
Results by Opposition Team
| Opposition | Mat | Inn | NO | Runs | HS | Ave | SR | 100 | 50 | Overs | Maid | RunsA | Wkts | Ave | Best | 10W | 5WI | Cts | Sts | ROs |
|---|---|---|---|---|---|---|---|---|---|---|---|---|---|---|---|---|---|---|---|---|
| Country Cup | 1 | 1 | - | - | - | - | - | - | - | - | - | - | - | - | - | - | - | - | - | - |
| Doyalson | 2 | 3 | - | 21 | 19 | 7.00 | - | - | - | 2 | - | 13 | - | - | 0-13 | - | - | 1 | - | - |
| Gosford | 4 | 3 | - | 63 | 59 | 21.00 | - | - | 1 | - | - | - | - | - | - | - | - | 2 | - | - |
| Gosford\Mountains | 1 | 2 | - | 12 | 8 | 6.00 | - | - | - | - | - | - | - | - | - | - | - | 2 | - | - |
| Kincumber | 3 | 3 | 1 | 26 | 17 | 13.00 | - | - | - | 12 | 3 | 21 | 3 | 7.00 | 3-21 | - | - | 1 | - | - |
| Lisarow | 4 | 5 | - | 40 | 11 | 8.00 | - | - | - | 4 | - | 17 | - | - | 0-17 | - | - | 2 | - | - |
| Mountains | 1 | 1 | - | 10 | 10 | 10.00 | - | - | - | - | - | - | - | - | - | - | - | - | - | - |
| Terrigal-Matcham | 3 | 3 | 1 | 91 | 59* | 45.50 | - | - | 1 | - | - | - | - | - | - | - | - | 1 | - | - |
| The Entrance | 3 | 3 | - | 73 | 41 | 24.33 | - | - | - | 1.5 | - | 3 | 1 | 3.00 | 1-3 | - | - | 2 | - | - |
| Toukley | 3 | 1 | - | 58 | 58 | 58.00 | - | - | 1 | 5 | - | 25 | - | - | 0-25 | - | - | 1 | - | - |
| Umina | 3 | 3 | - | 43 | 24 | 14.33 | - | - | - | 1.1 | - | 3 | 1 | 3.00 | 1-0 | - | - | 2 | - | 2 |
| Woy Woy | 2 | 2 | - | 15 | 15 | 7.50 | - | - | - | - | - | - | - | - | - | - | - | 1 | - | - |
| Wyong | 3 | 4 | - | 82 | 48 | 20.50 | - | - | - | - | - | - | - | - | - | - | - | 1 | - | - |
Results by Ground
| Ground | Mat | Inn | NO | Runs | HS | Ave | SR | 100 | 50 | Overs | Maid | RunsA | Wkts | Ave | Best | 10W | 5WI | Cts | Sts | ROs |
|---|---|---|---|---|---|---|---|---|---|---|---|---|---|---|---|---|---|---|---|---|
| Alan Davidson | 4 | 7 | - | 41 | 15 | 5.86 | - | - | - | 7.1 | - | 33 | 1 | 33.00 | 1-0 | - | - | 5 | - | 2 |
| Baker Park | 1 | 2 | - | 50 | 48 | 25.00 | - | - | - | - | - | - | - | - | - | - | - | - | - | - |
| Bateau Bay North | 1 | 1 | - | 1 | 1 | 1.00 | - | - | - | 1.5 | - | 3 | 1 | 3.00 | 1-3 | - | - | 1 | - | - |
| Col Gooley Oval | 1 | 1 | - | 1 | 1 | 1.00 | - | - | - | - | - | - | - | - | - | - | - | - | - | - |
| Country Cup Away | 1 | 1 | - | - | - | - | - | - | - | - | - | - | - | - | - | - | - | - | - | - |
| Duffys Road | 1 | 2 | 1 | 79 | 59* | 79.00 | - | - | 1 | - | - | - | - | - | - | - | - | - | - | - |
| Fagans Park | 2 | 1 | - | 4 | 4 | 4.00 | - | - | - | - | - | - | - | - | - | - | - | 2 | - | - |
| Frost Reserve | 1 | 1 | - | 17 | 17 | 17.00 | - | - | - | 12 | 3 | 21 | 3 | 7.00 | 3-21 | - | - | 1 | - | - |
| Gavenlock Oval | 12 | 10 | 1 | 112 | 31 | 12.44 | - | - | - | - | - | - | - | - | - | - | - | 2 | - | - |
| Harry Moore | 2 | 1 | - | 58 | 58 | 58.00 | - | - | 1 | 5 | - | 25 | - | - | 0-25 | - | - | 1 | - | - |
| Jubilee Park | 1 | 1 | - | 41 | 41 | 41.00 | - | - | - | - | - | - | - | - | - | - | - | 1 | - | - |
| Kurraba | 1 | 1 | - | 11 | 11 | 11.00 | - | - | - | - | - | - | - | - | - | - | - | - | - | - |
| McEvoy | 1 | 1 | - | 59 | 59 | 59.00 | - | - | 1 | - | - | - | - | - | - | - | - | - | - | - |
| Paul Oval | 1 | 1 | - | 12 | 12 | 12.00 | - | - | - | - | - | - | - | - | - | - | - | 1 | - | - |
| Sohier Park | 2 | 2 | - | 17 | 9 | 8.50 | - | - | - | - | - | - | - | - | - | - | - | 1 | - | - |
| Taylor Park | 1 | 1 | - | 31 | 31 | 31.00 | - | - | - | - | - | - | - | - | - | - | - | 1 | - | - |
Stats by Cricket Statz | Last updated 27-Apr-2025.