Robert Hay
All Matches, All Grades, Narara, 02-Nov-1935 to 15-Mar-2025
The Var is the variance of the scores to the mean. It is a measure of how reliable the batsman is at reaching their average. A low variance indicates the batsman will often get scores close to his average. A high variance indicates his scores are fairly unpredictable.
| Mat | Cts | ROs | Sts | GFs | GFWon |
|---|---|---|---|---|---|
| 349 | 145 | 3 | - | 7 | 4 |
Results by Season
| Season | Mat | Inn | NO | Runs | HS | Ave | SR | 100 | 50 | Overs | Maid | RunsA | Wkts | Ave | Best | 10W | 5WI | Cts | Sts | ROs |
|---|---|---|---|---|---|---|---|---|---|---|---|---|---|---|---|---|---|---|---|---|
| 1990/91 | 13 | 13 | - | 418 | 72 | 32.15 | - | - | 4 | - | - | - | - | - | - | - | - | 9 | - | - |
| 1991/92 | 12 | 13 | 1 | 211 | 63 | 17.58 | - | - | 1 | - | - | - | - | - | - | - | - | 3 | - | - |
| 1992/93 | 12 | 12 | - | 180 | 47 | 15.00 | - | - | - | - | - | - | - | - | - | - | - | 3 | - | - |
| 1993/94 | 8 | 9 | 3 | 254 | 52 | 42.33 | - | - | 3 | - | - | - | - | - | - | - | - | 3 | - | - |
| 1994/95 | 14 | 13 | - | 194 | 69 | 14.92 | - | - | 1 | - | - | - | - | - | - | - | - | 4 | - | - |
| 1995/96 | 14 | 16 | 1 | 441 | 103* | 29.40 | - | 1 | 2 | - | - | - | - | - | - | - | - | 10 | - | - |
| 1996/97 | 13 | 12 | - | 299 | 92 | 24.92 | - | - | 2 | 2 | 1 | 1 | - | - | 0-1 | - | - | 9 | - | - |
| 1997/98 | 11 | 11 | 1 | 284 | 64 | 28.40 | - | - | 1 | 4 | 1 | 8 | 1 | 8.00 | 1-8 | - | - | 7 | - | - |
| 1998/99 | 12 | 12 | 1 | 157 | 40 | 14.27 | - | - | - | - | - | - | - | - | - | - | - | 4 | - | 1 |
| 1999/00 | 8 | 9 | 1 | 160 | 76 | 20.00 | - | - | 1 | 2 | - | 9 | - | - | 0-9 | - | - | 3 | - | - |
| 2000/01 | 11 | 11 | - | 274 | 65 | 24.91 | - | - | 1 | 1 | - | 5 | - | - | 0-5 | - | - | 2 | - | - |
| 2001/02 | 13 | 14 | 1 | 295 | 63 | 22.69 | - | - | 2 | - | - | - | - | - | - | - | - | 10 | - | - |
| 2002/03 | 14 | 16 | - | 443 | 82 | 27.69 | - | - | 4 | - | - | - | - | - | - | - | - | 10 | - | - |
| 2003/04 | 11 | 11 | 2 | 107 | 33 | 11.89 | - | - | - | 2 | 1 | 2 | - | - | 0-2 | - | - | 7 | - | - |
| 2004/05 | 11 | 10 | - | 270 | 91 | 27.00 | - | - | 2 | 4 | - | 12 | - | - | 0-1 | - | - | 7 | - | - |
| 2005/06 | 13 | 13 | - | 270 | 72 | 20.77 | - | - | 1 | 6 | - | 37 | 1 | 37.00 | 1-20 | - | - | 9 | - | - |
| 2006/07 | 13 | 14 | 1 | 284 | 48 | 21.85 | - | - | - | 7 | 2 | 29 | - | - | 0-5 | - | - | 8 | - | - |
| 2007/08 | 10 | 10 | 1 | 238 | 72 | 26.44 | - | - | 1 | - | - | - | - | - | - | - | - | 2 | - | - |
| 2008/09 | 13 | 12 | 2 | 206 | 67 | 20.60 | - | - | 1 | - | - | - | - | - | - | - | - | 6 | - | - |
| 2012/13 | 10 | 14 | 1 | 151 | 50 | 11.62 | - | - | 1 | - | - | - | - | - | - | - | - | 3 | - | - |
| 2013/14 | 12 | 13 | 1 | 238 | 57 | 19.83 | - | - | 1 | - | - | - | - | - | - | - | - | 2 | - | 1 |
| 2014/15 | 14 | 13 | 2 | 163 | 34 | 14.82 | - | - | - | .1 | - | 4 | - | - | 0-4 | - | - | 3 | - | - |
| 2016/17 | 9 | 8 | - | 132 | 36 | 16.50 | - | - | - | - | - | - | - | - | - | - | - | 4 | - | - |
| 2017/18 | 10 | 11 | - | 132 | 37 | 12.00 | - | - | - | - | - | - | - | - | - | - | - | 2 | - | 1 |
| 2018/19 | 14 | 13 | - | 204 | 36 | 15.69 | - | - | - | - | - | - | - | - | - | - | - | 3 | - | - |
| 2019/20 | 9 | 9 | - | 22 | 10 | 2.44 | 51.85 | - | - | - | - | - | - | - | - | - | - | - | - | - |
| 2022/23 | 16 | 17 | 3 | 247 | 52* | 17.64 | - | - | 1 | - | - | - | - | - | - | - | - | 3 | - | - |
| 2023/24 | 16 | 15 | - | 93 | 27 | 6.20 | - | - | - | - | - | - | - | - | - | - | - | 7 | - | - |
| 2024/25 | 13 | 12 | - | 56 | 12 | 4.67 | - | - | - | - | - | - | - | - | - | - | - | 2 | - | - |
Results by Grade
| Grade | Mat | Inn | NO | Runs | HS | Ave | SR | 100 | 50 | Overs | Maid | RunsA | Wkts | Ave | Best | 10W | 5WI | Cts | Sts | ROs |
|---|---|---|---|---|---|---|---|---|---|---|---|---|---|---|---|---|---|---|---|---|
| 1st Grade | 25 | 22 | 3 | 265 | 67 | 13.95 | - | - | 1 | - | - | - | - | - | - | - | - | 12 | - | 1 |
| 2nd Grade | 124 | 126 | 5 | 1921 | 72 | 15.88 | 51.85 | - | 3 | 11 | 3 | 40 | - | - | 0-2 | - | - | 40 | - | 1 |
| 3rd Grade | 139 | 142 | 7 | 2723 | 91 | 20.17 | - | - | 16 | 15 | 2 | 54 | 2 | 27.00 | 1-8 | - | - | 69 | - | - |
| 4th Grade | 17 | 18 | 1 | 693 | 103* | 40.76 | - | 1 | 6 | - | - | - | - | - | - | - | - | 12 | - | - |
| 5th Grade | 6 | 6 | 1 | 215 | 76 | 43.00 | - | - | 2 | 2 | - | 9 | - | - | 0-9 | - | - | 4 | - | - |
| Division 1 | 34 | 37 | 3 | 536 | 57 | 15.76 | - | - | 2 | .1 | - | 4 | - | - | 0-4 | - | - | 8 | - | 1 |
| Division 3 | 1 | 1 | 1 | 14 | 14* | - | - | - | - | - | - | - | - | - | - | - | - | - | - | - |
| NSW Country Cup | 2 | 2 | 1 | 54 | 35 | 54.00 | - | - | - | - | - | - | - | - | - | - | - | - | - | - |
| Premier League | 1 | 2 | - | 2 | 2 | 1.00 | - | - | - | - | - | - | - | - | - | - | - | - | - | - |
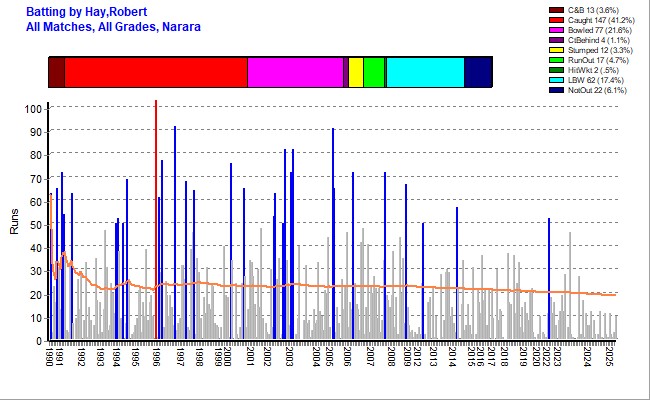
Batting Statistics
| Inns | NOs | Runs | HS | Ave | Var% | 50s | 100s | 4s | 6s | Ret |
|---|---|---|---|---|---|---|---|---|---|---|
| 356 | 22 | 6423 | 103* Vs TMCC 1995/96 | 19.23 | 100.31% | 30 | 1 | 276 | 15 | - |
Batting Highlights
| Score/s | Team | Vs | Ground | Grade | Date |
|---|---|---|---|---|---|
| 52* | Narara 3rd | Lisarow | Gavenlock Oval | 3rd Grade | 22-Oct-2022 |
| 57{lb} | Narara 1st Divis | Lisarow | Gavenlock Oval | Division 1 | 11-Jan-2014 |
| 50{ct} | Narara 1st Divis | Terrigal-Matcham | Duffys Road | Division 1 | 27-Oct-2012 |
| 67{st} | Narara 1st | Umina | Gavenlock Oval | 1st Grade | 06-Dec-2008 |
| 72{b} | Narara 2nd | Mountains | Adcock Park | 2nd Grade | 13-Oct-2007 |
| 72{hw} | Narara 2nd | Woy Woy | Gavenlock Oval | 2nd Grade | 11-Feb-2006 |
| 65{ct} | Narara 3rd | Kincumber | Carrington St | 3rd Grade | 19-Feb-2005 |
| 91{ct} | Narara 3rd | Lisarow | Sohier Park | 3rd Grade | 05-Feb-2005 |
| 82{ro} | Narara 3rd | Doyalson | Carrington St | 3rd Grade | 18-Jan-2003 |
| 72{ct} | Narara 3rd | Lisarow | Kurraba | 3rd Grade | 04-Jan-2003 |
| 82{ct} | Narara 3rd | Gosford | Adcock #7 | 3rd Grade | 02-Nov-2002 |
| 50{b} | Narara 3rd | Toukley | Carrington St | 3rd Grade | 19-Oct-2002 |
| 63{ro} | Narara 3rd | Gosford | Carrington St | 3rd Grade | 09-Feb-2002 |
| 53{ct} | Narara 3rd | Doyalson | Doyalson #3 | 3rd Grade | 26-Jan-2002 |
| 65{lb} | Narara 2nd | Kincumber | Gavenlock Oval | 2nd Grade | 21-Oct-2000 |
| 76{ct} | Narara 5th Green | Umina | Paddy Clifton No1 | 5th Grade | 15-Jan-2000 |
| 64{ct} | Narara 3rd | Lisarow | Alan Davidson | 3rd Grade | 01-Nov-1997 |
| 68{ct} | Narara 3rd | Gosford | Alan Davidson | 3rd Grade | 01-Mar-1997 |
| 92{lb} | Narara 4th | Terrigal-Matcham | Paul Oval | 4th Grade | 09-Nov-1996 |
| 77{ct} | Narara 4th | Woy Woy | Woy Woy #2 | 4th Grade | 17-Feb-1996 |
| 61{ct} | Narara 4th | Gosford | Fagans Park | 4th Grade | 20-Jan-1996 |
| 103* | Narara 4th | Terrigal-Matcham | Alan Davidson | 4th Grade | 16-Dec-1995 |
| 69{ct} | Narara 3rd | Umina | Alan Davidson | 3rd Grade | 15-Oct-1994 |
| 50* | Narara 3rd | Wyong | Alan Davidson | 3rd Grade | 26-Feb-1994 |
| 52{ct} | Narara 3rd | Doyalson | Alan Davidson | 3rd Grade | 15-Jan-1994 |
| 50{ct} | Narara 3rd | Gosford | Alan Davidson | 3rd Grade | 18-Dec-1993 |
| 63{ct} | Narara 3rd | Terrigal-Matcham | Alan Davidson | 3rd Grade | 05-Oct-1991 |
| 54{ro} | Narara 4th | Doyalson | Doyalson #2 | 4th Grade | 02-Feb-1991 |
| 72{ct} | Narara 4th | Mountains | Alan Davidson | 4th Grade | 19-Jan-1991 |
| 65{b} | Narara 4th | Toukley | Alan Davidson | 4th Grade | 01-Dec-1990 |
| 63{ct} | Narara 5th | Umina | McEvoy | 5th Grade | 06-Oct-1990 |
Results by Batting Position
| Position | Inn | NO | Runs | HS | Ave | SR | 100 | 50 |
|---|---|---|---|---|---|---|---|---|
| Open | 181 | 9 | 3791 | 103* | 22.04 | - | 1 | 24 |
| 3 | 46 | 1 | 700 | 67 | 15.56 | 51.85 | - | 2 |
| 4 | 24 | 2 | 302 | 48 | 13.73 | - | - | - |
| 5 | 49 | 1 | 830 | 68 | 17.29 | - | - | 3 |
| 6 | 29 | 1 | 456 | 72 | 16.29 | - | - | 1 |
| 7 | 13 | 3 | 183 | 35* | 18.30 | - | - | - |
| 8 | 8 | 1 | 119 | 26 | 17.00 | - | - | - |
| 9 | 5 | 3 | 40 | 18* | 20.00 | - | - | - |
| 10 | 1 | 1 | 2 | 2* | - | - | - | - |
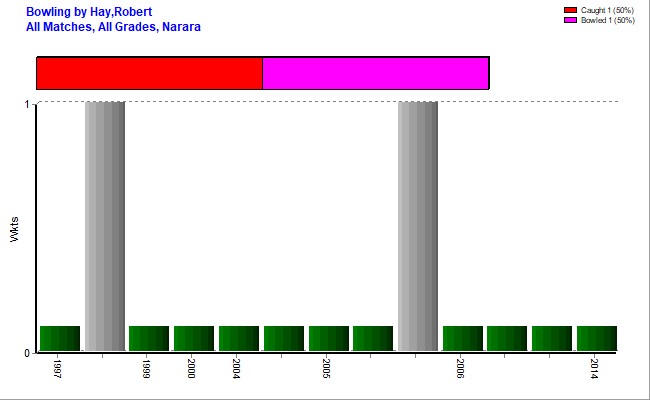
Bowling Statistics
| Overs | Maids | RunsA | Wkts | Best | Ave | 5WI | 10WM | Econ | SR |
|---|---|---|---|---|---|---|---|---|---|
| 28.1 | 5 | 107 | 2 | 1-8 Vs LOCC 1997/98 | 53.50 | - | - | 3.80 | 84.50 |
First Match
| Batting | Bowling | Team | Vs | Ground | Date |
|---|---|---|---|---|---|
| 63{ct} | Narara 5th | Umina | McEvoy | 06-Oct-1990 |
Results by Opposition Team
| Opposition | Mat | Inn | NO | Runs | HS | Ave | SR | 100 | 50 | Overs | Maid | RunsA | Wkts | Ave | Best | 10W | 5WI | Cts | Sts | ROs |
|---|---|---|---|---|---|---|---|---|---|---|---|---|---|---|---|---|---|---|---|---|
| Brisbane Water | 10 | 11 | 1 | 202 | 36 | 20.20 | - | - | - | - | - | - | - | - | - | - | - | 1 | - | - |
| Country Cup | 2 | 2 | 1 | 54 | 35 | 54.00 | - | - | - | - | - | - | - | - | - | - | - | - | - | - |
| Doyalson | 16 | 18 | 1 | 418 | 82 | 24.59 | - | - | 4 | 2 | - | 5 | - | - | 0-5 | - | - | 7 | - | - |
| Gosford | 17 | 16 | - | 493 | 82 | 30.81 | - | - | 5 | - | - | - | - | - | - | - | - | 10 | - | - |
| Gosford\Mountains | 1 | 1 | - | 1 | 1 | 1.00 | - | - | - | - | - | - | - | - | - | - | - | - | - | - |
| Kincumber | 49 | 54 | 2 | 684 | 65 | 13.15 | - | - | 2 | 3 | 1 | 7 | - | - | 0-2 | - | - | 22 | - | - |
| Lisarow | 38 | 39 | 2 | 774 | 91 | 20.92 | - | - | 5 | 8 | 1 | 32 | 1 | 32.00 | 1-8 | - | - | 11 | - | 2 |
| Mountains | 19 | 19 | - | 481 | 72 | 25.32 | - | - | 2 | 7 | 1 | 22 | 1 | 22.00 | 1-20 | - | - | 15 | - | - |
| Northern Power | 11 | 11 | 1 | 107 | 30 | 10.70 | - | - | - | .1 | - | 4 | - | - | 0-4 | - | - | 3 | - | - |
| Southern Spirit | 7 | 4 | - | 54 | 21 | 13.50 | - | - | - | - | - | - | - | - | - | - | - | 2 | - | - |
| Terrigal-Matcham | 30 | 31 | 2 | 684 | 103* | 23.59 | 50.00 | 1 | 3 | - | - | - | - | - | - | - | - | 12 | - | 1 |
| The Entrance | 42 | 42 | 3 | 539 | 46 | 13.82 | 18.18 | - | - | 3 | - | 13 | - | - | 0-4 | - | - | 11 | - | - |
| Toukley | 19 | 19 | 2 | 325 | 65 | 19.12 | - | - | 2 | - | - | - | - | - | - | - | - | 11 | - | - |
| Umina | 23 | 24 | 2 | 622 | 76 | 28.27 | - | - | 4 | - | - | - | - | - | - | - | - | 7 | - | - |
| Warnervale | 10 | 9 | 1 | 79 | 36 | 9.88 | 83.33 | - | - | - | - | - | - | - | - | - | - | 3 | - | - |
| Woy Woy | 19 | 22 | 1 | 505 | 77 | 24.05 | - | - | 2 | - | - | - | - | - | - | - | - | 14 | - | - |
| Wyong | 36 | 34 | 3 | 401 | 50* | 12.94 | - | - | 1 | 5 | 2 | 24 | - | - | 0-24 | - | - | 16 | - | - |
Results by Ground
| Ground | Mat | Inn | NO | Runs | HS | Ave | SR | 100 | 50 | Overs | Maid | RunsA | Wkts | Ave | Best | 10W | 5WI | Cts | Sts | ROs |
|---|---|---|---|---|---|---|---|---|---|---|---|---|---|---|---|---|---|---|---|---|
| Adcock #3 | 3 | 3 | - | 25 | 24 | 8.33 | - | - | - | - | - | - | - | - | - | - | - | - | - | - |
| Adcock #7 | 1 | 1 | - | 82 | 82 | 82.00 | - | - | 1 | - | - | - | - | - | - | - | - | 1 | - | - |
| Adcock Park | 10 | 11 | 1 | 167 | 72 | 16.70 | - | - | 1 | - | - | - | - | - | - | - | - | 3 | - | - |
| Alan Davidson | 30 | 31 | 4 | 1039 | 103* | 38.48 | - | 1 | 9 | 4 | 1 | 8 | 1 | 8.00 | 1-8 | - | - | 15 | - | - |
| Avoca Oval | 5 | 5 | - | 87 | 33 | 17.40 | - | - | - | - | - | - | - | - | - | - | - | - | - | - |
| Baker Park | 6 | 5 | - | 73 | 40 | 14.60 | - | - | - | - | - | - | - | - | - | - | - | 1 | - | - |
| Bateau Bay North | 2 | 2 | - | 63 | 38 | 31.50 | - | - | - | - | - | - | - | - | - | - | - | 1 | - | - |
| Bill Sohier Park (Sohie | 3 | 4 | - | 3 | 3 | 0.75 | - | - | - | - | - | - | - | - | - | - | - | - | - | - |
| Carrington St | 29 | 32 | 1 | 809 | 82 | 26.10 | - | - | 4 | 11 | 2 | 49 | 1 | 49.00 | 1-20 | - | - | 26 | - | - |
| Col Gooley Oval | 4 | 4 | - | 36 | 21 | 9.00 | - | - | - | - | - | - | - | - | - | - | - | 1 | - | - |
| Country Cup Away | 1 | 1 | 1 | 19 | 19* | - | - | - | - | - | - | - | - | - | - | - | - | - | - | - |
| Darren Kennedy | 2 | 2 | 1 | 12 | 12* | 12.00 | - | - | - | - | - | - | - | - | - | - | - | 1 | - | - |
| Doyalson #1 | 3 | 3 | - | 40 | 19 | 13.33 | - | - | - | - | - | - | - | - | - | - | - | 3 | - | - |
| Doyalson #2 | 1 | 1 | - | 54 | 54 | 54.00 | - | - | 1 | - | - | - | - | - | - | - | - | 1 | - | - |
| Doyalson #3 | 3 | 4 | - | 71 | 53 | 17.75 | - | - | 1 | - | - | - | - | - | - | - | - | 2 | - | - |
| Duffys Road | 14 | 15 | 1 | 167 | 50 | 11.93 | - | - | 1 | - | - | - | - | - | - | - | - | 4 | - | 1 |
| EDSACC Sth | 3 | 3 | - | 14 | 8 | 4.67 | - | - | - | - | - | - | - | - | - | - | - | 1 | - | - |
| Erina | 11 | 11 | 1 | 82 | 29 | 8.20 | - | - | - | - | - | - | - | - | - | - | - | 5 | - | - |
| Fagans Park | 12 | 10 | - | 142 | 61 | 14.20 | - | - | 1 | - | - | - | - | - | - | - | - | 6 | - | - |
| Frost Reserve | 3 | 3 | - | 47 | 33 | 15.67 | - | - | - | 2 | 1 | 2 | - | - | 0-2 | - | - | 5 | - | - |
| Gavenlock Oval | 92 | 93 | 3 | 1447 | 72 | 16.08 | 51.85 | - | 5 | 2.1 | - | 13 | - | - | 0-4 | - | - | 25 | - | 2 |
| Halekulani Oval | 1 | 1 | - | 23 | 23 | 23.00 | - | - | - | - | - | - | - | - | - | - | - | 1 | - | - |
| Hamlyn Terrace Oval [TB | 3 | 3 | - | 49 | 46 | 16.33 | - | - | - | - | - | - | - | - | - | - | - | 1 | - | - |
| Harry Moore | 6 | 5 | - | 91 | 34 | 18.20 | - | - | - | - | - | - | - | - | - | - | - | 3 | - | - |
| Hasslett Oval | 2 | 2 | - | 2 | 2 | 1.00 | - | - | - | - | - | - | - | - | - | - | - | - | - | - |
| Jubilee Park | 5 | 6 | 1 | 89 | 30 | 17.80 | - | - | - | - | - | - | - | - | - | - | - | 2 | - | - |
| Kanwal Park | 7 | 7 | - | 71 | 28 | 10.14 | - | - | - | - | - | - | - | - | - | - | - | 1 | - | - |
| Kariong | 3 | 3 | - | 85 | 44 | 28.33 | - | - | - | 3 | 1 | 2 | - | - | 0-1 | - | - | 4 | - | - |
| Kurraba | 1 | 1 | - | 72 | 72 | 72.00 | - | - | 1 | - | - | - | - | - | - | - | - | 1 | - | - |
| Mandalong Oval | 3 | 3 | - | 62 | 36 | 20.67 | - | - | - | - | - | - | - | - | - | - | - | 2 | - | - |
| McEvoy | 8 | 8 | - | 155 | 63 | 19.38 | - | - | 1 | - | - | - | - | - | - | - | - | 5 | - | - |
| McKillopOval | 4 | 4 | - | 33 | 18 | 8.25 | - | - | - | - | - | - | - | - | - | - | - | 1 | - | - |
| Paddy Clifton No1 | 2 | 2 | 1 | 94 | 76 | 94.00 | - | - | 1 | 2 | - | 9 | - | - | 0-9 | - | - | - | - | - |
| Paul Oval | 3 | 3 | - | 143 | 92 | 47.67 | - | - | 1 | - | - | - | - | - | - | - | - | 1 | - | - |
| Rogers Park | 11 | 10 | 1 | 76 | 23* | 8.44 | - | - | - | - | - | - | - | - | - | - | - | 4 | - | - |
| Rogers Park #2 | 1 | 1 | - | 19 | 19 | 19.00 | - | - | - | - | - | - | - | - | - | - | - | 1 | - | - |
| Sohier Park | 13 | 13 | - | 287 | 91 | 22.08 | - | - | 1 | 4 | - | 24 | - | - | 0-11 | - | - | 4 | - | - |
| Tacoma | 12 | 13 | 1 | 143 | 35 | 11.92 | - | - | - | - | - | - | - | - | - | - | - | 3 | - | - |
| Taylor Park | 4 | 4 | - | 60 | 30 | 15.00 | - | - | - | - | - | - | - | - | - | - | - | - | - | - |
| Terrigal Haven | 1 | 1 | - | 5 | 5 | 5.00 | - | - | - | - | - | - | - | - | - | - | - | - | - | - |
| Toukley #1 | 2 | 2 | - | 22 | 13 | 11.00 | - | - | - | - | - | - | - | - | - | - | - | 2 | - | - |
| Toukley #2 | 3 | 3 | 1 | 38 | 29* | 19.00 | - | - | - | - | - | - | - | - | - | - | - | 2 | - | - |
| Umina #1 | 4 | 4 | 2 | 69 | 35* | 34.50 | - | - | - | - | - | - | - | - | - | - | - | - | - | - |
| Umina #2 | 2 | 2 | - | 11 | 8 | 5.50 | - | - | - | - | - | - | - | - | - | - | - | 1 | - | - |
| Woongarrah Oval | 2 | 2 | 1 | 14 | 14* | 14.00 | - | - | - | - | - | - | - | - | - | - | - | - | - | - |
| Woy Woy #1 | 2 | 2 | 1 | 46 | 44 | 46.00 | - | - | - | - | - | - | - | - | - | - | - | 1 | - | - |
| Woy Woy #2 | 6 | 7 | - | 185 | 77 | 26.43 | - | - | 1 | - | - | - | - | - | - | - | - | 4 | - | - |
Stats by Cricket Statz | Last updated 27-Apr-2025.