Bradley Watson
All Matches, All Grades, Narara, 02-Nov-1935 to 15-Mar-2025
The Var is the variance of the scores to the mean. It is a measure of how reliable the batsman is at reaching their average. A low variance indicates the batsman will often get scores close to his average. A high variance indicates his scores are fairly unpredictable.
| Mat | Cts | ROs | Sts | GFs | GFWon |
|---|---|---|---|---|---|
| 31 | 11 | 2 | - | - | - |
Results by Season
| Season | Mat | Inn | NO | Runs | HS | Ave | SR | 100 | 50 | Overs | Maid | RunsA | Wkts | Ave | Best | 10W | 5WI | Cts | Sts | ROs |
|---|---|---|---|---|---|---|---|---|---|---|---|---|---|---|---|---|---|---|---|---|
| 2008/09 | 3 | 2 | - | 13 | 10 | 6.50 | - | - | - | 14.2 | 4 | 29 | 3 | 9.67 | 1-6 | - | - | 3 | - | - |
| 2009/10 | 16 | 17 | 3 | 137 | 39 | 9.79 | - | - | - | 110 | 22 | 370 | 20 | 18.50 | 4-25 | - | - | 5 | - | - |
| 2010/11 | 12 | 9 | 3 | 96 | 35* | 16.00 | - | - | - | 109.1 | 24 | 255 | 14 | 18.21 | 3-13 | - | - | 3 | - | 2 |
Results by Grade
| Grade | Mat | Inn | NO | Runs | HS | Ave | SR | 100 | 50 | Overs | Maid | RunsA | Wkts | Ave | Best | 10W | 5WI | Cts | Sts | ROs |
|---|---|---|---|---|---|---|---|---|---|---|---|---|---|---|---|---|---|---|---|---|
| 3rd Grade | 1 | 1 | 1 | - | 0* | - | - | - | - | 8 | - | 39 | - | - | 0-18 | - | - | 1 | - | - |
| 4th Grade | 18 | 20 | 3 | 191 | 39 | 11.24 | - | - | - | 144.1 | 33 | 429 | 17 | 25.24 | 3-43 | - | - | 4 | - | 1 |
| 5th Grade | 3 | 1 | - | - | - | - | - | - | - | 34 | 8 | 55 | 7 | 7.86 | 3-13 | - | - | 1 | - | 1 |
| 7th Grade | 6 | 4 | 2 | 42 | 21 | 21.00 | - | - | - | 32 | 7 | 95 | 10 | 9.50 | 4-25 | - | - | 4 | - | - |
| 8th Grade | 2 | 2 | - | 13 | 10 | 6.50 | - | - | - | 9.2 | 1 | 21 | 2 | 10.50 | 1-6 | - | - | 1 | - | - |
| U21 | 1 | - | - | - | - | - | - | - | - | 6 | 1 | 15 | 1 | 15.00 | 1-15 | - | - | - | - | - |
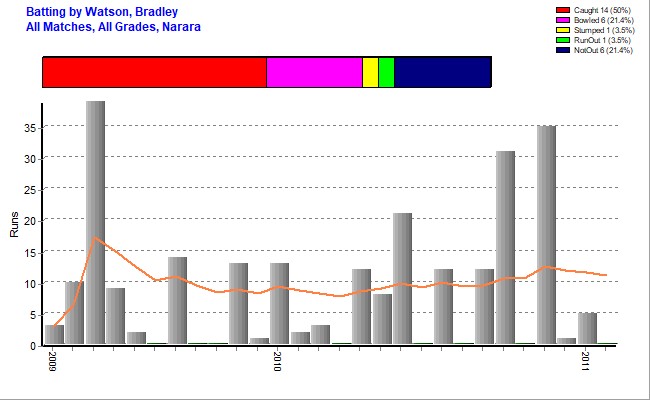
Batting Statistics
| Inns | NOs | Runs | HS | Ave | Var% | 50s | 100s | 4s | 6s | Ret |
|---|---|---|---|---|---|---|---|---|---|---|
| 28 | 6 | 246 | 39 Vs TCC 2009/10 | 11.18 | 99.15% | - | - | 11 | 3 | - |
Results by Batting Position
| Position | Inn | NO | Runs | HS | Ave | SR | 100 | 50 |
|---|---|---|---|---|---|---|---|---|
| 3 | 2 | - | 6 | 3 | 3.00 | - | - | - |
| 4 | 1 | - | 21 | 21 | 21.00 | - | - | - |
| 7 | 2 | - | 10 | 10 | 5.00 | - | - | - |
| 8 | 6 | - | 39 | 14 | 6.50 | - | - | - |
| 9 | 5 | 2 | 21 | 12* | 7.00 | - | - | - |
| 10 | 7 | 3 | 101 | 39 | 25.25 | - | - | - |
| 11 | 4 | - | 48 | 31 | 12.00 | - | - | - |
| 12 | 1 | 1 | - | 0* | - | - | - | - |
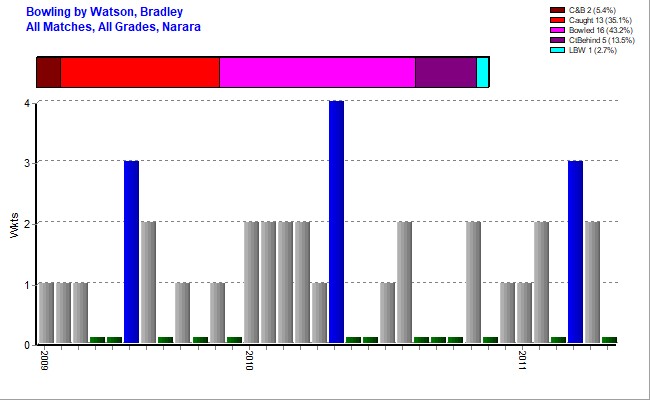
Bowling Statistics
| Overs | Maids | RunsA | Wkts | Best | Ave | 5WI | 10WM | Econ | SR |
|---|---|---|---|---|---|---|---|---|---|
| 233.3 | 50 | 654 | 37 | 4-25 Vs KCC 2009/10 | 17.68 | - | - | 2.80 | 37.86 |
First Match
| Batting | Bowling | Team | Vs | Ground | Date |
|---|---|---|---|---|---|
| 3{ct} | 1-6 | Narara 8th | Woy Woy | James Brown | 31-Jan-2009 |
Results by Opposition Team
| Opposition | Mat | Inn | NO | Runs | HS | Ave | SR | 100 | 50 | Overs | Maid | RunsA | Wkts | Ave | Best | 10W | 5WI | Cts | Sts | ROs |
|---|---|---|---|---|---|---|---|---|---|---|---|---|---|---|---|---|---|---|---|---|
| Doyalson | 1 | - | - | - | - | - | - | - | - | 9 | 2 | 31 | 2 | 15.50 | 2-31 | - | - | - | - | 1 |
| Gosford | 2 | - | - | - | - | - | - | - | - | 7 | 3 | 17 | 1 | 17.00 | 1-8 | - | - | 2 | - | 1 |
| Kincumber | 3 | 3 | - | 33 | 21 | 11.00 | - | - | - | 29 | 3 | 84 | 7 | 12.00 | 4-25 | - | - | 1 | - | - |
| Lisarow | 6 | 5 | 1 | 23 | 13 | 5.75 | - | - | - | 29 | 6 | 89 | 5 | 17.80 | 2-24 | - | - | - | - | - |
| Mountains | 2 | 2 | 1 | 35 | 35* | 35.00 | - | - | - | 17 | 7 | 28 | - | - | 0-8 | - | - | 1 | - | - |
| Terrigal-Matcham | 2 | 3 | - | 45 | 31 | 15.00 | - | - | - | 15 | 1 | 50 | - | - | 0-17 | - | - | 1 | - | - |
| The Entrance | 4 | 4 | 2 | 23 | 13* | 11.50 | - | - | - | 19.2 | 2 | 66 | 3 | 22.00 | 2-12 | - | - | 2 | - | - |
| Toukley | 2 | 2 | 1 | 51 | 39 | 51.00 | - | - | - | 13.4 | 5 | 15 | - | - | 0-2 | - | - | - | - | - |
| Umina | 2 | 1 | - | 5 | 5 | 5.00 | - | - | - | 19.3 | 6 | 56 | 3 | 18.67 | 2-29 | - | - | 1 | - | - |
| Warnervale | 2 | 1 | 1 | 12 | 12* | - | - | - | - | 26 | 4 | 80 | 4 | 20.00 | 2-11 | - | - | - | - | - |
| Woy Woy | 3 | 4 | - | 8 | 3 | 2.00 | - | - | - | 28 | 8 | 50 | 8 | 6.25 | 3-13 | - | - | 3 | - | - |
| Wyong | 2 | 3 | - | 11 | 9 | 3.67 | - | - | - | 21 | 3 | 88 | 4 | 22.00 | 3-43 | - | - | - | - | - |
Results by Ground
| Ground | Mat | Inn | NO | Runs | HS | Ave | SR | 100 | 50 | Overs | Maid | RunsA | Wkts | Ave | Best | 10W | 5WI | Cts | Sts | ROs |
|---|---|---|---|---|---|---|---|---|---|---|---|---|---|---|---|---|---|---|---|---|
| Alan Davidson | 4 | 3 | 2 | 20 | 12* | 20.00 | - | - | - | 14.4 | 6 | 37 | 1 | 37.00 | 1-19 | - | - | - | - | 1 |
| Carrington St | 8 | 8 | 1 | 82 | 39 | 11.71 | - | - | - | 71 | 17 | 206 | 10 | 20.60 | 2-18 | - | - | 3 | - | 1 |
| Col Gooley Oval | 1 | 1 | - | 5 | 5 | 5.00 | - | - | - | 7.3 | - | 27 | 1 | 27.00 | 1-27 | - | - | 1 | - | - |
| Eastern Road | 1 | 1 | - | 10 | 10 | 10.00 | - | - | - | 5.2 | - | 15 | 1 | 15.00 | 1-15 | - | - | - | - | - |
| Gavenlock Oval | 1 | - | - | - | - | - | - | - | - | 6 | 1 | 15 | 1 | 15.00 | 1-15 | - | - | - | - | - |
| James Brown | 1 | 1 | - | 3 | 3 | 3.00 | - | - | - | 4 | 1 | 6 | 1 | 6.00 | 1-6 | - | - | 1 | - | - |
| Kanwal Park | 1 | 1 | - | - | - | - | - | - | - | 9 | 2 | 22 | 1 | 22.00 | 1-22 | - | - | - | - | - |
| Kariong | 1 | 1 | 1 | 35 | 35* | - | - | - | - | 7 | 3 | 8 | - | - | 0-8 | - | - | - | - | - |
| Ozanam Oval | 1 | 1 | - | - | - | - | - | - | - | 10 | 1 | 41 | 1 | 41.00 | 1-41 | - | - | - | - | - |
| Paddy Clifton No1 | 1 | - | - | - | - | - | - | - | - | 7 | 1 | 24 | 2 | 12.00 | 2-24 | - | - | - | - | - |
| Paddy Clifton No2 | 1 | - | - | - | - | - | - | - | - | 5 | 3 | 8 | 1 | 8.00 | 1-8 | - | - | 2 | - | - |
| Pat Morley | 1 | 1 | 1 | 13 | 13* | - | - | - | - | 6 | 2 | 12 | 2 | 6.00 | 2-12 | - | - | 1 | - | - |
| Paul Oval | 1 | 1 | - | 31 | 31 | 31.00 | - | - | - | 9 | 1 | 33 | - | - | 0-33 | - | - | - | - | - |
| Saratoga Oval | 1 | 1 | - | 21 | 21 | 21.00 | - | - | - | 9 | - | 25 | 4 | 6.25 | 4-25 | - | - | 1 | - | - |
| Sohier Park | 2 | 3 | - | 15 | 13 | 5.00 | - | - | - | 11 | 3 | 24 | 1 | 24.00 | 1-20 | - | - | - | - | - |
| Tacoma | 1 | 2 | - | 11 | 9 | 5.50 | - | - | - | 12 | 1 | 66 | 3 | 22.00 | 3-43 | - | - | - | - | - |
| Taylor Park | 2 | 2 | 1 | - | 0* | - | - | - | - | 8 | - | 39 | - | - | 0-18 | - | - | 1 | - | - |
| Tunkuwallin | 1 | - | - | - | - | - | - | - | - | 18 | 3 | 29 | 2 | 14.50 | 2-11 | - | - | - | - | - |
| Woy Woy #2 | 1 | 1 | - | - | - | - | - | - | - | 14 | 5 | 17 | 5 | 3.40 | 3-13 | - | - | 1 | - | - |
Stats by Cricket Statz | Last updated 27-Apr-2025.