Jamie Glason
All Matches, All Grades, Narara, 02-Nov-1935 to 15-Mar-2025
The Var is the variance of the scores to the mean. It is a measure of how reliable the batsman is at reaching their average. A low variance indicates the batsman will often get scores close to his average. A high variance indicates his scores are fairly unpredictable.
| Mat | Cts | ROs | Sts | GFs | GFWon |
|---|---|---|---|---|---|
| 33 | 13 | 1 | - | - | - |
Results by Season
| Season | Mat | Inn | NO | Runs | HS | Ave | SR | 100 | 50 | Overs | Maid | RunsA | Wkts | Ave | Best | 10W | 5WI | Cts | Sts | ROs |
|---|---|---|---|---|---|---|---|---|---|---|---|---|---|---|---|---|---|---|---|---|
| 2008/09 | 19 | 18 | 4 | 647 | 130* | 46.21 | - | 1 | 4 | 119 | 31 | 293 | 26 | 11.27 | 4-0 | - | - | 8 | - | 1 |
| 2009/10 | 14 | 13 | 1 | 436 | 94 | 36.33 | - | - | 3 | 107 | 14 | 369 | 22 | 16.77 | 4-26 | - | - | 5 | - | - |
Results by Grade
| Grade | Mat | Inn | NO | Runs | HS | Ave | SR | 100 | 50 | Overs | Maid | RunsA | Wkts | Ave | Best | 10W | 5WI | Cts | Sts | ROs |
|---|---|---|---|---|---|---|---|---|---|---|---|---|---|---|---|---|---|---|---|---|
| 3rd Grade | 1 | 2 | - | 10 | 6 | 5.00 | - | - | - | 4 | - | 23 | - | - | 0-23 | - | - | - | - | - |
| 7th Grade | 32 | 29 | 5 | 1073 | 130* | 44.71 | - | 1 | 7 | 222 | 45 | 639 | 48 | 13.31 | 4-0 | - | - | 13 | - | 1 |
Batting Statistics
| Inns | NOs | Runs | HS | Ave | Var% | 50s | 100s | 4s | 6s | Ret |
|---|---|---|---|---|---|---|---|---|---|---|
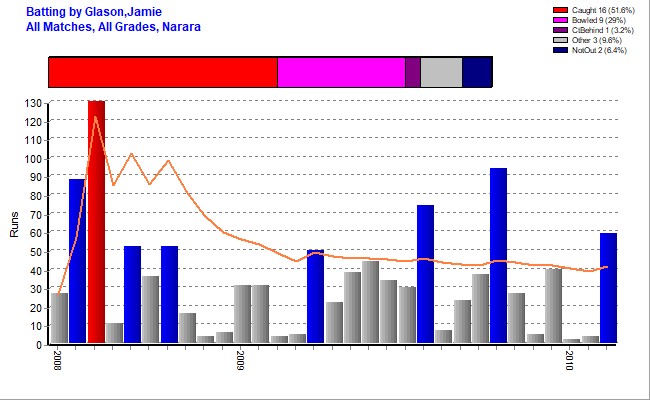
| 31 | 5 | 1083 | 130* Vs TECC 2008/09 | 41.65 | 63.77% | 7 | 1 | 117 | 54 | 3 |
Batting Highlights
| Score/s | Team | Vs | Ground | Grade | Date |
|---|---|---|---|---|---|
| 59* | Narara 7th | Umina | Alan Davidson | 7th Grade | 30-Jan-2010 |
| 94{ct} | Narara 7th | Doyalson | Alan Davidson | 7th Grade | 28-Nov-2009 |
| 74{b} | Narara 7th | Lisarow | Alan Davidson | 7th Grade | 24-Oct-2009 |
| 50* | Narara 7th | Gosford | Paddy Clifton No2 | 7th Grade | 14-Feb-2009 |
| 52* | Narara 7th | Kincumber | Paddy Clifton No2 | 7th Grade | 29-Nov-2008 |
| 52* | Narara 7th | Woy Woy | Woy Woy #2 | 7th Grade | 08-Nov-2008 |
| 130* | Narara 7th | The Entrance | Paddy Clifton No2 | 7th Grade | 25-Oct-2008 |
| 88{ct} | Narara 7th | Doyalson | Paddy Clifton No2 | 7th Grade | 11-Oct-2008 |
Results by Batting Position
| Position | Inn | NO | Runs | HS | Ave | SR | 100 | 50 |
|---|---|---|---|---|---|---|---|---|
| Open | 2 | 1 | 93 | 59* | 93.00 | - | - | 1 |
| 3 | 2 | - | 54 | 38 | 27.00 | - | - | - |
| 4 | 2 | - | 57 | 30 | 28.50 | - | - | - |
| 5 | 10 | 1 | 228 | 52* | 25.33 | - | - | 1 |
| 6 | 13 | 3 | 618 | 130* | 61.80 | - | 1 | 5 |
| 7 | 1 | - | 6 | 6 | 6.00 | - | - | - |
| 8 | 1 | - | 27 | 27 | 27.00 | - | - | - |
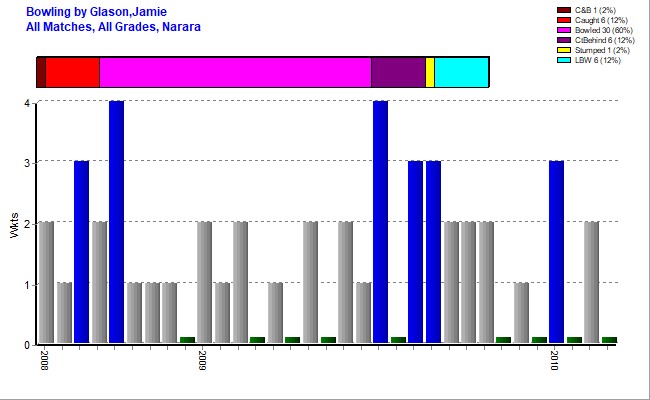
Bowling Statistics
| Overs | Maids | RunsA | Wkts | Best | Ave | 5WI | 10WM | Econ | SR |
|---|---|---|---|---|---|---|---|---|---|
| 226 | 45 | 662 | 48 | 4-0 Vs WWCC 2008/09 | 13.79 | - | - | 2.93 | 28.25 |
First Match
| Batting | Bowling | Team | Vs | Ground | Date |
|---|---|---|---|---|---|
| 27{ct} | 2-6 | Narara 7th | Terrigal-Matcham | Hasslett Oval | 04-Oct-2008 |
Results by Opposition Team
| Opposition | Mat | Inn | NO | Runs | HS | Ave | SR | 100 | 50 | Overs | Maid | RunsA | Wkts | Ave | Best | 10W | 5WI | Cts | Sts | ROs |
|---|---|---|---|---|---|---|---|---|---|---|---|---|---|---|---|---|---|---|---|---|
| Doyalson | 2 | 2 | - | 182 | 94 | 91.00 | - | - | 2 | 13 | 1 | 41 | 3 | 13.67 | 2-30 | - | - | - | - | - |
| Gosford | 2 | 2 | 1 | 86 | 50* | 86.00 | - | - | 1 | 11 | 4 | 23 | 1 | 23.00 | 1-15 | - | - | - | - | - |
| Kincumber | 5 | 4 | 1 | 108 | 52* | 36.00 | - | - | 1 | 34 | 3 | 107 | 8 | 13.38 | 3-40 | - | - | 2 | - | - |
| Lisarow | 9 | 8 | - | 179 | 74 | 22.38 | - | - | 1 | 64 | 12 | 202 | 11 | 18.36 | 3-37 | - | - | 4 | - | - |
| Terrigal-Matcham | 1 | 1 | - | 27 | 27 | 27.00 | - | - | - | 3 | 1 | 6 | 2 | 3.00 | 2-6 | - | - | - | - | - |
| The Entrance | 4 | 4 | 1 | 200 | 130* | 66.67 | - | 1 | - | 28 | 10 | 50 | 9 | 5.56 | 3-13 | - | - | 2 | - | - |
| Toukley | 1 | 1 | - | 38 | 38 | 38.00 | - | - | - | 9 | 2 | 28 | 2 | 14.00 | 2-28 | - | - | - | - | - |
| Umina | 4 | 4 | 1 | 164 | 59* | 54.67 | - | - | 1 | 29 | 5 | 94 | 6 | 15.67 | 4-26 | - | - | 3 | - | - |
| Warnervale | 2 | 2 | - | 38 | 22 | 19.00 | - | - | - | 15 | 2 | 38 | 1 | 38.00 | 1-11 | - | - | 1 | - | 1 |
| Woy Woy | 2 | 2 | 1 | 56 | 52* | 56.00 | - | - | 1 | 11 | 4 | 41 | 4 | 10.25 | 4-0 | - | - | 1 | - | - |
| Wyong | 1 | 1 | - | 5 | 5 | 5.00 | - | - | - | 9 | 1 | 32 | 1 | 32.00 | 1-32 | - | - | - | - | - |
Results by Ground
| Ground | Mat | Inn | NO | Runs | HS | Ave | SR | 100 | 50 | Overs | Maid | RunsA | Wkts | Ave | Best | 10W | 5WI | Cts | Sts | ROs |
|---|---|---|---|---|---|---|---|---|---|---|---|---|---|---|---|---|---|---|---|---|
| Adcock #7 | 1 | 1 | - | 36 | 36 | 36.00 | - | - | - | 6 | 2 | 15 | 1 | 15.00 | 1-15 | - | - | - | - | - |
| Alan Davidson | 9 | 10 | 1 | 340 | 94 | 37.78 | - | - | 3 | 65 | 5 | 252 | 14 | 18.00 | 4-26 | - | - | 2 | - | - |
| Col Gooley Oval | 1 | 1 | - | 40 | 40 | 40.00 | - | - | - | 7 | 1 | 29 | - | - | 0-29 | - | - | - | - | - |
| Darren Kennedy | 1 | 1 | - | 38 | 38 | 38.00 | - | - | - | 9 | 2 | 28 | 2 | 14.00 | 2-28 | - | - | - | - | - |
| Hasslett Oval | 1 | 1 | - | 27 | 27 | 27.00 | - | - | - | 3 | 1 | 6 | 2 | 3.00 | 2-6 | - | - | - | - | - |
| Hylton Moore | 1 | 1 | - | 44 | 44 | 44.00 | - | - | - | 7 | 1 | 12 | 1 | 12.00 | 1-12 | - | - | - | - | - |
| Mascord | 1 | 1 | - | 22 | 22 | 22.00 | - | - | - | 9 | 2 | 27 | - | - | 0-27 | - | - | 1 | - | 1 |
| Paddy Clifton No1 | 5 | 4 | - | 76 | 31 | 19.00 | - | - | - | 35 | 9 | 92 | 6 | 15.33 | 2-3 | - | - | 5 | - | - |
| Paddy Clifton No2 | 5 | 4 | 3 | 320 | 130* | 320.00 | - | 1 | 3 | 30 | 10 | 63 | 7 | 9.00 | 3-14 | - | - | 2 | - | - |
| Pat Morley | 2 | 2 | - | 33 | 31 | 16.50 | - | - | - | 13 | 4 | 26 | 4 | 6.50 | 3-13 | - | - | - | - | - |
| Saratoga Oval | 2 | 1 | - | 7 | 7 | 7.00 | - | - | - | 15 | - | 54 | 5 | 10.80 | 3-40 | - | - | 2 | - | - |
| St Edwards | 1 | 1 | - | 27 | 27 | 27.00 | - | - | - | 9 | 4 | 15 | - | - | 0-15 | - | - | 1 | - | - |
| Tacoma | 1 | 1 | - | 5 | 5 | 5.00 | - | - | - | 9 | 1 | 32 | 1 | 32.00 | 1-32 | - | - | - | - | - |
| Tunkuwallin | 1 | 1 | - | 16 | 16 | 16.00 | - | - | - | 6 | - | 11 | 1 | 11.00 | 1-11 | - | - | - | - | - |
| Woy Woy #2 | 1 | 1 | 1 | 52 | 52* | - | - | - | 1 | 3 | 3 | - | 4 | - | 4-0 | - | - | - | - | - |
Stats by Cricket Statz | Last updated 27-Apr-2025.