Joshua Glason
All Matches, All Grades, Narara, 02-Nov-1935 to 15-Mar-2025
The Var is the variance of the scores to the mean. It is a measure of how reliable the batsman is at reaching their average. A low variance indicates the batsman will often get scores close to his average. A high variance indicates his scores are fairly unpredictable.
| Mat | Cts | ROs | Sts | GFs | GFWon |
|---|---|---|---|---|---|
| 68 | 34 | 1 | - | - | - |
Results by Season
| Season | Mat | Inn | NO | Runs | HS | Ave | SR | 100 | 50 | Overs | Maid | RunsA | Wkts | Ave | Best | 10W | 5WI | Cts | Sts | ROs |
|---|---|---|---|---|---|---|---|---|---|---|---|---|---|---|---|---|---|---|---|---|
| 2008/09 | 19 | 18 | 5 | 568 | 176* | 43.69 | - | 1 | 3 | 134.2 | 11 | 499 | 33 | 15.12 | 6-42 | - | 1 | 8 | - | - |
| 2009/10 | 15 | 13 | 2 | 534 | 88 | 48.55 | - | - | 6 | 79.5 | 4 | 405 | 11 | 36.82 | 2-29 | - | - | 10 | - | - |
| 2011/12 | 8 | 8 | - | 76 | 57 | 9.50 | - | - | 1 | 28 | - | 154 | 6 | 25.67 | 3-32 | - | - | 3 | - | - |
| 2013/14 | 2 | 1 | - | - | - | - | - | - | - | 5 | - | 27 | - | - | 0-27 | - | - | 1 | - | - |
| 2018/19 | 14 | 13 | 1 | 198 | 43 | 16.50 | - | - | - | 23 | 2 | 122 | 11 | 11.09 | 3-23 | - | - | 9 | - | 1 |
| 2019/20 | 10 | 9 | 2 | 118 | 41 | 16.86 | 50.00 | - | - | - | - | - | - | - | - | - | - | 3 | - | - |
Results by Grade
| Grade | Mat | Inn | NO | Runs | HS | Ave | SR | 100 | 50 | Overs | Maid | RunsA | Wkts | Ave | Best | 10W | 5WI | Cts | Sts | ROs |
|---|---|---|---|---|---|---|---|---|---|---|---|---|---|---|---|---|---|---|---|---|
| 5th Grade | 10 | 9 | 2 | 118 | 41 | 16.86 | 50.00 | - | - | - | - | - | - | - | - | - | - | 3 | - | - |
| 7th Grade | 48 | 44 | 8 | 1300 | 176* | 36.11 | - | 1 | 9 | 237.1 | 17 | 1026 | 55 | 18.65 | 6-42 | - | 1 | 27 | - | 1 |
| Division 3 | 2 | 1 | - | - | - | - | - | - | - | 5 | - | 27 | - | - | 0-27 | - | - | 1 | - | - |
| Division 4 | 1 | 1 | - | 1 | 1 | 1.00 | - | - | - | 5 | - | 28 | 1 | 28.00 | 1-28 | - | - | 1 | - | - |
| ODLO 1st Grade | 7 | 7 | - | 75 | 57 | 10.71 | - | - | 1 | 23 | - | 126 | 5 | 25.20 | 3-32 | - | - | 2 | - | - |
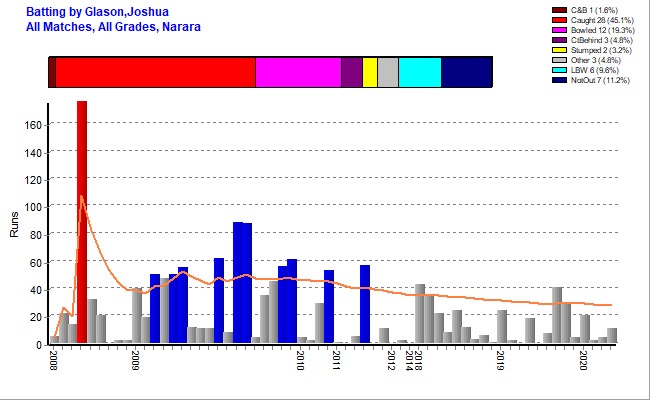
Batting Statistics
| Inns | NOs | Runs | HS | Ave | Var% | 50s | 100s | 4s | 6s | Ret |
|---|---|---|---|---|---|---|---|---|---|---|
| 62 | 10 | 1494 | 176* Vs WWCC 2008/09 | 28.73 | 107.72% | 10 | 1 | 161 | 60 | 3 |
Batting Highlights
| Score/s | Team | Vs | Ground | Grade | Date |
|---|---|---|---|---|---|
| 57{b} | Narara OD 1st Gr | Terrigal-Matcham | Terrigal Haven | ODLO 1st Grade | 29-Oct-2011 |
| 53{ct} | Narara 7th | Lisarow | Alan Davidson | 7th Grade | 27-Feb-2010 |
| 61{ct} | Narara 7th | Umina | Col Gooley Oval | 7th Grade | 19-Dec-2009 |
| 56{b} | Narara 7th | Kincumber | Alan Davidson | 7th Grade | 12-Dec-2009 |
| 87{ct} | Narara 7th | Lisarow | Alan Davidson | 7th Grade | 07-Nov-2009 |
| 88{st} | Narara 7th | Kincumber | Saratoga Oval | 7th Grade | 31-Oct-2009 |
| 62* | Narara 7th | Umina | Alan Davidson | 7th Grade | 10-Oct-2009 |
| 55* | Narara 7th | Gosford | Paddy Clifton No2 | 7th Grade | 14-Feb-2009 |
| 50* | Narara 7th | Wyong | Tacoma | 7th Grade | 07-Feb-2009 |
| 50* | Narara 7th | Lisarow | Paddy Clifton No2 | 7th Grade | 24-Jan-2009 |
| 176* | Narara 7th | Woy Woy | Woy Woy #2 | 7th Grade | 08-Nov-2008 |
Results by Batting Position
| Position | Inn | NO | Runs | HS | Ave | SR | 100 | 50 |
|---|---|---|---|---|---|---|---|---|
| Open | 4 | - | 8 | 6 | 2.00 | - | - | - |
| 3 | 23 | 3 | 800 | 176* | 40.00 | - | 1 | 5 |
| 4 | 6 | 2 | 271 | 62* | 67.75 | - | - | 4 |
| 5 | 4 | - | 54 | 29 | 13.50 | - | - | - |
| 6 | 9 | - | 158 | 57 | 17.56 | - | - | 1 |
| 7 | 10 | 4 | 171 | 43 | 28.50 | 33.33 | - | - |
| 8 | 4 | 1 | 26 | 11* | 8.67 | 55.00 | - | - |
| 9 | 1 | - | 1 | 1 | 1.00 | - | - | - |
| 11 | 1 | - | 5 | 5 | 5.00 | - | - | - |
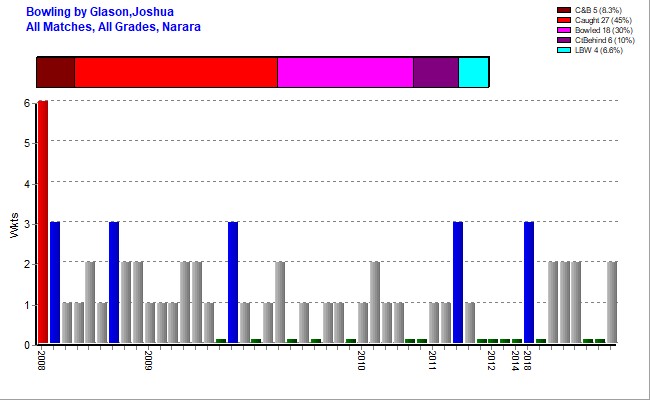
Bowling Statistics
| Overs | Maids | RunsA | Wkts | Best | Ave | 5WI | 10WM | Econ | SR |
|---|---|---|---|---|---|---|---|---|---|
| 270.1 | 17 | 1207 | 61 | 6-42 Vs DWCC 2008/09 | 19.79 | 1 | - | 4.47 | 26.57 |
Bowling Highlights
| O-M-R-W | Team | Vs | Ground | Grade | Date |
|---|---|---|---|---|---|
| 9-1-42-6 | Narara 7th | Doyalson | Paddy Clifton No2 | 7th Grade | 11-Oct-2008 |
First Match
| Batting | Bowling | Team | Vs | Ground | Date |
|---|---|---|---|---|---|
| 5* | 6-42 | Narara 7th | Doyalson | Paddy Clifton No2 | 11-Oct-2008 |
Results by Opposition Team
| Opposition | Mat | Inn | NO | Runs | HS | Ave | SR | 100 | 50 | Overs | Maid | RunsA | Wkts | Ave | Best | 10W | 5WI | Cts | Sts | ROs |
|---|---|---|---|---|---|---|---|---|---|---|---|---|---|---|---|---|---|---|---|---|
| Brisbane Water | 3 | 3 | - | 43 | 35 | 14.33 | - | - | - | 3 | 1 | 13 | 2 | 6.50 | 2-13 | - | - | 2 | - | - |
| Doyalson | 3 | 3 | 1 | 54 | 45 | 27.00 | - | - | - | 22 | 1 | 125 | 7 | 17.86 | 6-42 | - | 1 | 2 | - | - |
| Gosford | 2 | 2 | 1 | 87 | 55* | 87.00 | - | - | 1 | 12 | 1 | 36 | 3 | 12.00 | 2-17 | - | - | - | - | - |
| Kincumber | 8 | 7 | - | 192 | 88 | 27.43 | 33.33 | - | 2 | 32.4 | 2 | 139 | 3 | 46.33 | 2-13 | - | - | 3 | - | 1 |
| Lisarow | 11 | 10 | 2 | 265 | 87 | 33.12 | - | - | 3 | 61 | 3 | 278 | 10 | 27.80 | 2-29 | - | - | 6 | - | - |
| Northern Power | 2 | 1 | 1 | 29 | 29* | - | - | - | - | - | - | - | - | - | - | - | - | - | - | - |
| Terrigal-Matcham | 10 | 10 | 2 | 175 | 57 | 21.88 | 55.00 | - | 1 | 20 | - | 136 | 8 | 17.00 | 3-23 | - | - | 4 | - | - |
| The Entrance | 8 | 8 | - | 140 | 41 | 17.50 | - | - | - | 26 | 2 | 154 | 7 | 22.00 | 3-71 | - | - | 3 | - | - |
| Toukley | 2 | 2 | - | 13 | 11 | 6.50 | - | - | - | 15 | 2 | 42 | 3 | 14.00 | 2-11 | - | - | 1 | - | - |
| Umina | 5 | 4 | 1 | 163 | 62* | 54.33 | - | - | 2 | 18.3 | 1 | 88 | 3 | 29.33 | 1-0 | - | - | 6 | - | - |
| Warnervale | 3 | 3 | - | 24 | 12 | 8.00 | - | - | - | 20 | 1 | 53 | 6 | 8.83 | 3-22 | - | - | 3 | - | - |
| Woy Woy | 3 | 3 | 1 | 225 | 176* | 112.50 | - | 1 | - | 20 | 2 | 63 | 3 | 21.00 | 2-24 | - | - | - | - | - |
| Wyong | 8 | 6 | 1 | 84 | 50* | 16.80 | - | - | 1 | 20 | 1 | 80 | 6 | 13.33 | 2-17 | - | - | 4 | - | - |
Results by Ground
| Ground | Mat | Inn | NO | Runs | HS | Ave | SR | 100 | 50 | Overs | Maid | RunsA | Wkts | Ave | Best | 10W | 5WI | Cts | Sts | ROs |
|---|---|---|---|---|---|---|---|---|---|---|---|---|---|---|---|---|---|---|---|---|
| Adcock #7 | 4 | 4 | - | 69 | 35 | 17.25 | - | - | - | 11 | 1 | 34 | 3 | 11.33 | 2-17 | - | - | 3 | - | - |
| Alan Davidson | 19 | 17 | 2 | 515 | 87 | 34.33 | - | - | 4 | 78.5 | 4 | 418 | 17 | 24.59 | 3-23 | - | - | 13 | - | - |
| Blue Haven | 1 | 1 | - | 4 | 4 | 4.00 | - | - | - | 4 | - | 29 | - | - | 0-29 | - | - | - | - | - |
| Carrington St | 3 | 3 | - | 24 | 20 | 8.00 | - | - | - | - | - | - | - | - | - | - | - | 1 | - | - |
| Col Gooley Oval | 2 | 2 | - | 61 | 61 | 30.50 | - | - | 1 | 5 | - | 27 | - | - | 0-27 | - | - | 1 | - | - |
| Darren Kennedy | 1 | 1 | - | 11 | 11 | 11.00 | - | - | - | 9 | 1 | 31 | 1 | 31.00 | 1-31 | - | - | 1 | - | - |
| Don Small Oval | 1 | - | - | - | - | - | - | - | - | - | - | - | - | - | - | - | - | - | - | - |
| Doyalson #2 | 1 | - | - | - | - | - | - | - | - | - | - | - | - | - | - | - | - | - | - | - |
| EDSACC Sth | 1 | 1 | - | 41 | 41 | 41.00 | - | - | - | - | - | - | - | - | - | - | - | 1 | - | - |
| Frost Reserve | 3 | 3 | - | 17 | 8 | 5.67 | 33.33 | - | - | 5 | 1 | 13 | 2 | 6.50 | 2-13 | - | - | 1 | - | 1 |
| Harry Moore | 1 | 1 | 1 | 29 | 29* | - | - | - | - | - | - | - | - | - | - | - | - | - | - | - |
| Hylton Moore | 1 | 1 | - | 11 | 11 | 11.00 | - | - | - | 7 | 1 | 23 | - | - | 0-23 | - | - | - | - | - |
| Kanwal Park | 1 | 1 | - | 1 | 1 | 1.00 | - | - | - | 5 | - | 28 | 1 | 28.00 | 1-28 | - | - | 1 | - | - |
| Kurraba | 1 | 1 | - | - | - | - | - | - | - | 3 | - | 19 | - | - | 0-19 | - | - | 1 | - | - |
| Lisarow Sporting Field | 1 | 1 | - | 18 | 18 | 18.00 | - | - | - | - | - | - | - | - | - | - | - | 1 | - | - |
| Mascord | 1 | 1 | - | 12 | 12 | 12.00 | - | - | - | 9 | - | 22 | 3 | 7.33 | 3-22 | - | - | - | - | - |
| McKillopOval | 1 | 1 | 1 | 11 | 11* | - | 55.00 | - | - | - | - | - | - | - | - | - | - | - | - | - |
| Morrie Breen | 1 | 1 | - | - | - | - | - | - | - | 3 | - | 10 | 1 | 10.00 | 1-10 | - | - | - | - | - |
| North Lakes | 1 | 1 | - | 11 | 11 | 11.00 | - | - | - | 2 | - | 26 | - | - | 0-26 | - | - | - | - | - |
| Paddy Clifton No1 | 5 | 4 | 1 | 103 | 47 | 34.33 | - | - | - | 29.1 | 2 | 118 | 7 | 16.86 | 2-24 | - | - | 2 | - | - |
| Paddy Clifton No2 | 6 | 6 | 3 | 154 | 55* | 51.33 | - | - | 2 | 42.1 | 3 | 184 | 14 | 13.14 | 6-42 | - | 1 | 3 | - | - |
| Pat Morley | 2 | 2 | - | 20 | 19 | 10.00 | - | - | - | 6 | 1 | 19 | 1 | 19.00 | 1-19 | - | - | - | - | - |
| Paul Oval | 2 | 2 | - | 7 | 4 | 3.50 | - | - | - | 2 | - | 16 | - | - | 0-16 | - | - | - | - | - |
| Saratoga Oval | 2 | 1 | - | 88 | 88 | 88.00 | - | - | 1 | 9 | - | 33 | - | - | 0-15 | - | - | 1 | - | - |
| Tacoma | 1 | 1 | 1 | 50 | 50* | - | - | - | 1 | 9 | 1 | 25 | 2 | 12.50 | 2-25 | - | - | 2 | - | - |
| Terrigal Haven | 2 | 2 | - | 59 | 57 | 29.50 | - | - | 1 | 11 | - | 71 | 5 | 14.20 | 3-32 | - | - | - | - | - |
| Tunkuwallin | 1 | 1 | - | - | - | - | - | - | - | 9 | 1 | 22 | 3 | 7.33 | 3-22 | - | - | 2 | - | - |
| Woy Woy #2 | 2 | 2 | 1 | 178 | 176* | 178.00 | - | 1 | - | 11 | 1 | 39 | 1 | 39.00 | 1-17 | - | - | - | - | - |
Stats by Cricket Statz | Last updated 27-Apr-2025.