Peter Sherwood
All Matches, All Grades, Narara, 02-Nov-1935 to 15-Mar-2025
The Var is the variance of the scores to the mean. It is a measure of how reliable the batsman is at reaching their average. A low variance indicates the batsman will often get scores close to his average. A high variance indicates his scores are fairly unpredictable.
| Mat | Cts | ROs | Sts | GFs | GFWon |
|---|---|---|---|---|---|
| 143 | 29 | 6 | - | - | - |
Results by Season
| Season | Mat | Inn | NO | Runs | HS | Ave | SR | 100 | 50 | Overs | Maid | RunsA | Wkts | Ave | Best | 10W | 5WI | Cts | Sts | ROs |
|---|---|---|---|---|---|---|---|---|---|---|---|---|---|---|---|---|---|---|---|---|
| 2007/08 | 10 | 14 | 2 | 52 | 21 | 4.33 | - | - | - | 58 | 4 | 276 | 8 | 34.50 | 3-12 | - | - | 2 | - | - |
| 2008/09 | 12 | 11 | 5 | 26 | 10 | 4.33 | - | - | - | 65.2 | 8 | 283 | 15 | 18.87 | 4-19 | - | - | 5 | - | - |
| 2009/10 | 17 | 13 | 3 | 76 | 23* | 7.60 | - | - | - | 103.2 | 10 | 501 | 14 | 35.79 | 2-25 | - | - | 2 | - | 2 |
| 2010/11 | 16 | 12 | 6 | 48 | 12* | 8.00 | - | - | - | 158 | 27 | 426 | 25 | 17.04 | 4-12 | - | - | 3 | - | 1 |
| 2011/12 | 6 | 5 | 4 | 8 | 2* | 8.00 | - | - | - | 40 | 6 | 132 | 2 | 66.00 | 2-11 | - | - | - | - | - |
| 2012/13 | 11 | 6 | 4 | 20 | 15 | 10.00 | - | - | - | 49.2 | 9 | 175 | 12 | 14.58 | 4-8 | - | - | 5 | - | - |
| 2013/14 | 11 | 9 | 5 | 46 | 13* | 11.50 | - | - | - | 79 | 16 | 295 | 10 | 29.50 | 3-41 | - | - | 2 | - | - |
| 2014/15 | 14 | 19 | 7 | 56 | 13 | 4.67 | - | - | - | 83.2 | 8 | 512 | 8 | 64.00 | 2-24 | - | - | 5 | - | 2 |
| 2015/16 | 12 | 10 | 6 | 37 | 18* | 9.25 | - | - | - | 125.3 | 30 | 365 | 27 | 13.52 | 5-23 | - | 1 | 1 | - | 1 |
| 2016/17 | 11 | 10 | 3 | 15 | 7 | 2.14 | - | - | - | 83.2 | 5 | 352 | 14 | 25.14 | 3-32 | - | - | 2 | - | - |
| 2017/18 | 12 | 11 | 3 | 49 | 14 | 6.12 | - | - | - | 76.1 | 6 | 376 | 15 | 25.07 | 5-32 | - | 1 | 1 | - | - |
| 2018/19 | 10 | 12 | 1 | 42 | 20 | 3.82 | - | - | - | 39.3 | 2 | 134 | 6 | 22.33 | 2-19 | - | - | 1 | - | - |
| 2023/24 | 1 | - | - | - | - | - | - | - | - | 7 | 3 | 13 | - | - | 0-13 | - | - | - | - | - |
Results by Grade
| Grade | Mat | Inn | NO | Runs | HS | Ave | SR | 100 | 50 | Overs | Maid | RunsA | Wkts | Ave | Best | 10W | 5WI | Cts | Sts | ROs |
|---|---|---|---|---|---|---|---|---|---|---|---|---|---|---|---|---|---|---|---|---|
| 10th Grade | 8 | 7 | 1 | 61 | 23* | 10.17 | - | - | - | 50.4 | 7 | 197 | 9 | 21.89 | 2-25 | - | - | - | - | - |
| 4th Grade | 1 | 1 | - | 2 | 2 | 2.00 | - | - | - | 5 | - | 22 | - | - | 0-22 | - | - | 1 | - | - |
| 5th Grade | 1 | 1 | 1 | - | 0* | - | - | - | - | 6 | - | 48 | 1 | 48.00 | 1-48 | - | - | 1 | - | - |
| 6th Grade | 40 | 41 | 10 | 150 | 21 | 4.84 | - | - | - | 282.4 | 33 | 1041 | 45 | 23.13 | 5-32 | - | 1 | 6 | - | 1 |
| 7th Grade | 36 | 30 | 13 | 95 | 18* | 5.59 | - | - | - | 279.3 | 39 | 1089 | 50 | 21.78 | 5-23 | - | 1 | 4 | - | 3 |
| 8th Grade | 13 | 11 | 4 | 28 | 10 | 4.00 | - | - | - | 74.2 | 11 | 303 | 15 | 20.20 | 4-19 | - | - | 5 | - | - |
| 9th Grade | 2 | 2 | - | 9 | 6 | 4.50 | - | - | - | 18 | 5 | 26 | 4 | 6.50 | 4-12 | - | - | - | - | - |
| Division 4 | 10 | 6 | 4 | 20 | 15 | 10.00 | - | - | - | 42.2 | 9 | 151 | 11 | 13.73 | 4-8 | - | - | 5 | - | - |
| Division 5 | 16 | 19 | 7 | 56 | 13 | 4.67 | - | - | - | 90.2 | 8 | 536 | 9 | 59.56 | 2-24 | - | - | 6 | - | 2 |
| Division 6 | 5 | 4 | 3 | 7 | 2* | 7.00 | - | - | - | 32 | 3 | 104 | 2 | 52.00 | 2-11 | - | - | - | - | - |
| Division 8 | 9 | 9 | 5 | 46 | 13* | 11.50 | - | - | - | 72 | 16 | 239 | 10 | 23.90 | 3-41 | - | - | - | - | - |
| Division 9 | 1 | - | - | - | - | - | - | - | - | 7 | - | 56 | - | - | 0-56 | - | - | 1 | - | - |
| ODLO 2nd Grade | 1 | 1 | 1 | 1 | 1* | - | - | - | - | 8 | 3 | 28 | - | - | 0-28 | - | - | - | - | - |
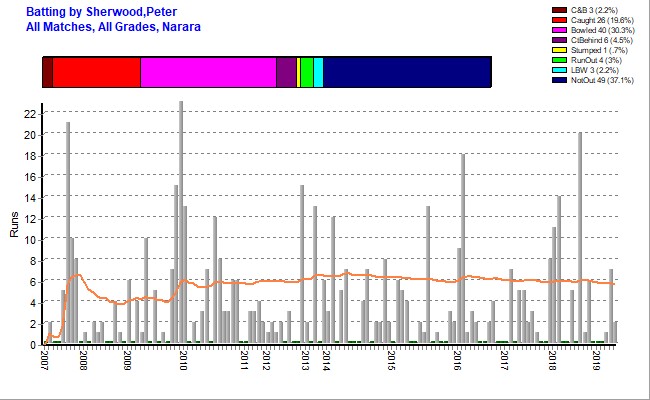
Batting Statistics
| Inns | NOs | Runs | HS | Ave | Var% | 50s | 100s | 4s | 6s | Ret |
|---|---|---|---|---|---|---|---|---|---|---|
| 132 | 49 | 475 | 23* Vs LOCC 2009/10 | 5.72 | 89.48% | - | - | 33 | 1 | - |
Results by Batting Position
| Position | Inn | NO | Runs | HS | Ave | SR | 100 | 50 |
|---|---|---|---|---|---|---|---|---|
| Open | 4 | - | 12 | 6 | 3.00 | - | - | - |
| 3 | 8 | - | 52 | 15 | 6.50 | - | - | - |
| 4 | 5 | 2 | 18 | 10 | 6.00 | - | - | - |
| 5 | 1 | 1 | 2 | 2* | - | - | - | - |
| 6 | 7 | - | 16 | 6 | 2.29 | - | - | - |
| 7 | 6 | - | 11 | 7 | 1.83 | - | - | - |
| 8 | 10 | 2 | 83 | 21 | 10.38 | - | - | - |
| 9 | 21 | 5 | 94 | 23* | 5.88 | - | - | - |
| 10 | 26 | 10 | 85 | 18* | 5.31 | - | - | - |
| 11 | 44 | 29 | 102 | 13* | 6.80 | - | - | - |
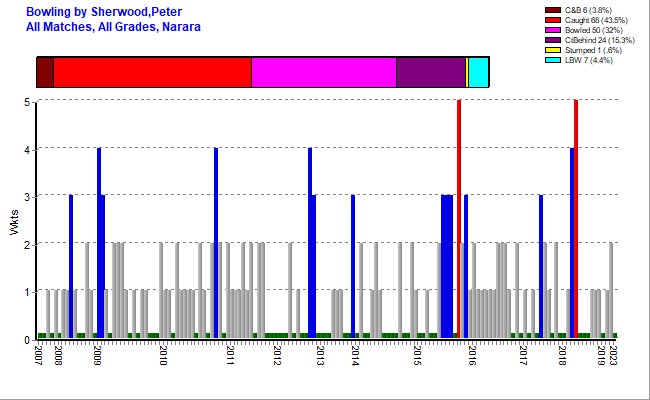
Bowling Statistics
| Overs | Maids | RunsA | Wkts | Best | Ave | 5WI | 10WM | Econ | SR |
|---|---|---|---|---|---|---|---|---|---|
| 967.5 | 134 | 3840 | 156 | 5-23 Vs NPCC 2015/16 | 24.62 | 2 | - | 3.97 | 37.22 |
Bowling Highlights
| O-M-R-W | Team | Vs | Ground | Grade | Date |
|---|---|---|---|---|---|
| 15-4-32-5 | Narara 6th | Kincumber | Hasslett Oval | 6th Grade | 24-Feb-2018 |
| 9.3-2-23-5 | Narara 7th | Northern Power | Harry Moore | 7th Grade | 24-Oct-2015 |
First Match
| Batting | Bowling | Team | Vs | Ground | Date |
|---|---|---|---|---|---|
| 0{st},2{b} | 0-53 | Narara 6th | Gosford | Alan Davidson | 06-Oct-2007 |
Results by Opposition Team
| Opposition | Mat | Inn | NO | Runs | HS | Ave | SR | 100 | 50 | Overs | Maid | RunsA | Wkts | Ave | Best | 10W | 5WI | Cts | Sts | ROs |
|---|---|---|---|---|---|---|---|---|---|---|---|---|---|---|---|---|---|---|---|---|
| Brisbane Water | 8 | 9 | 5 | 17 | 8 | 4.25 | - | - | - | 59.1 | 12 | 233 | 9 | 25.89 | 4-49 | - | - | 2 | - | - |
| Doyalson | 6 | 5 | 3 | 28 | 15 | 14.00 | - | - | - | 21 | - | 143 | 2 | 71.50 | 1-14 | - | - | 1 | - | - |
| Gosford | 4 | 5 | 1 | 16 | 13 | 4.00 | - | - | - | 22 | 3 | 95 | 1 | 95.00 | 1-8 | - | - | 1 | - | - |
| Kincumber | 16 | 18 | 5 | 50 | 12* | 3.85 | - | - | - | 124.2 | 23 | 481 | 26 | 18.50 | 5-32 | - | 1 | 3 | - | 2 |
| Lisarow | 22 | 20 | 8 | 39 | 23* | 3.25 | - | - | - | 156.4 | 10 | 732 | 15 | 48.80 | 2-16 | - | - | 2 | - | 2 |
| Mountains | 3 | 2 | - | 10 | 10 | 5.00 | - | - | - | 19 | 1 | 65 | 4 | 16.25 | 2-19 | - | - | 1 | - | - |
| Narara 10th White | 1 | 1 | - | 3 | 3 | 3.00 | - | - | - | 7 | - | 29 | 1 | 29.00 | 1-29 | - | - | - | - | - |
| Northern Power | 8 | 6 | 2 | 21 | 12 | 5.25 | - | - | - | 50.3 | 15 | 177 | 8 | 22.12 | 5-23 | - | 1 | 1 | - | - |
| Southern Spirit | 2 | 3 | - | 9 | 7 | 3.00 | - | - | - | 10.3 | - | 51 | 5 | 10.20 | 3-32 | - | - | 1 | - | - |
| Terrigal-Matcham | 9 | 12 | 5 | 62 | 18* | 8.86 | - | - | - | 75.4 | 12 | 279 | 12 | 23.25 | 3-54 | - | - | 1 | - | - |
| The Entrance | 14 | 11 | 3 | 19 | 8 | 2.38 | - | - | - | 112 | 16 | 358 | 20 | 17.90 | 3-12 | - | - | 3 | - | 1 |
| Toukley | 3 | 4 | 2 | 28 | 21 | 14.00 | - | - | - | 17 | - | 108 | 3 | 36.00 | 1-15 | - | - | 2 | - | - |
| Toukley Gold | 3 | 1 | 1 | 2 | 2* | - | - | - | - | 11 | - | 47 | 2 | 23.50 | 2-16 | - | - | 2 | - | - |
| Umina | 3 | - | - | - | - | - | - | - | - | 20 | 3 | 60 | 2 | 30.00 | 2-32 | - | - | - | - | - |
| Warnervale | 17 | 15 | 5 | 65 | 20 | 6.50 | - | - | - | 89 | 11 | 332 | 17 | 19.53 | 4-19 | - | - | 4 | - | 1 |
| Woy Woy | 5 | 4 | 1 | 27 | 10 | 9.00 | - | - | - | 36.2 | 5 | 130 | 8 | 16.25 | 4-12 | - | - | 2 | - | - |
| Wyong | 19 | 16 | 8 | 79 | 15 | 9.88 | - | - | - | 136.4 | 23 | 520 | 21 | 24.76 | 3-16 | - | - | 3 | - | - |
Results by Ground
| Ground | Mat | Inn | NO | Runs | HS | Ave | SR | 100 | 50 | Overs | Maid | RunsA | Wkts | Ave | Best | 10W | 5WI | Cts | Sts | ROs |
|---|---|---|---|---|---|---|---|---|---|---|---|---|---|---|---|---|---|---|---|---|
| Adcock #3 | 1 | 2 | 1 | 10 | 8 | 10.00 | - | - | - | 9 | 1 | 52 | 3 | 17.33 | 2-30 | - | - | 1 | - | - |
| Adcock #7 | 4 | 4 | 2 | 3 | 2* | 1.50 | - | - | - | 23 | 3 | 110 | 2 | 55.00 | 1-17 | - | - | - | - | - |
| Alan Davidson | 31 | 29 | 9 | 94 | 21 | 4.70 | - | - | - | 256.1 | 37 | 1044 | 39 | 26.77 | 4-49 | - | - | 4 | - | 3 |
| Austin Butler Oval | 1 | - | - | - | - | - | - | - | - | 7 | - | 56 | - | - | 0-56 | - | - | 1 | - | - |
| Bateau Bay South | 5 | 3 | 3 | 3 | 3* | - | - | - | - | 48 | 9 | 96 | 5 | 19.20 | 2-4 | - | - | - | - | - |
| Bloodtree Road | 1 | 1 | - | - | - | - | - | - | - | 3 | - | 17 | - | - | 0-17 | - | - | - | - | - |
| Blue Haven | 5 | 4 | 1 | 16 | 9* | 5.33 | - | - | - | 28 | - | 134 | 6 | 22.33 | 3-30 | - | - | 2 | - | - |
| Carrington St | 17 | 16 | 5 | 35 | 13 | 3.18 | - | - | - | 86.4 | 10 | 427 | 11 | 38.82 | 4-8 | - | - | 9 | - | - |
| Col Gooley Oval | 2 | 2 | - | 9 | 7 | 4.50 | - | - | - | 8.3 | 1 | 41 | 2 | 20.50 | 2-19 | - | - | 1 | - | - |
| Darren Kennedy | 5 | 2 | 2 | 2 | 2* | - | - | - | - | 20 | - | 113 | 1 | 113.00 | 1-48 | - | - | 1 | - | - |
| Don Small Oval | 1 | 1 | - | 6 | 6 | 6.00 | - | - | - | 4 | 1 | 12 | 1 | 12.00 | 1-12 | - | - | - | - | - |
| Doyalson #3 | 1 | 2 | - | 4 | 2 | 2.00 | - | - | - | 8 | 1 | 52 | - | - | 0-52 | - | - | - | - | - |
| Eastern Road | 2 | 2 | - | 8 | 8 | 4.00 | - | - | - | 13 | 1 | 45 | 4 | 11.25 | 2-14 | - | - | - | - | - |
| EDSACC North | 1 | 2 | 1 | - | 0* | - | - | - | - | 4 | 1 | 28 | - | - | 0-28 | - | - | - | - | 1 |
| Ettalong Oval | 2 | 2 | - | 7 | 7 | 3.50 | - | - | - | 14 | 2 | 42 | 4 | 10.50 | 3-32 | - | - | - | - | - |
| Frost Reserve | 1 | 1 | - | 6 | 6 | 6.00 | - | - | - | 14 | 4 | 28 | 2 | 14.00 | 2-28 | - | - | 1 | - | 1 |
| Halekulani Oval | 2 | 2 | 1 | 14 | 12 | 14.00 | - | - | - | 14 | 3 | 48 | 2 | 24.00 | 2-24 | - | - | - | - | - |
| Hamlyn Terrace Oval [TB | 2 | 2 | - | 23 | 20 | 11.50 | - | - | - | 6 | 1 | 22 | - | - | 0-0 | - | - | - | - | - |
| Harry Moore | 2 | 2 | 1 | 2 | 2* | 2.00 | - | - | - | 21.3 | 6 | 50 | 6 | 8.33 | 5-23 | - | 1 | - | - | - |
| Hasslett Oval | 4 | 4 | 1 | 12 | 6 | 4.00 | - | - | - | 41 | 8 | 119 | 11 | 10.82 | 5-32 | - | 1 | - | - | - |
| Heazlett Park | 1 | 1 | - | - | - | - | - | - | - | 3 | - | 11 | 1 | 11.00 | 1-11 | - | - | - | - | - |
| Hylton Moore | 5 | 5 | - | 29 | 13 | 5.80 | - | - | - | 22 | - | 107 | 5 | 21.40 | 2-41 | - | - | 1 | - | - |
| James Brown | 1 | 1 | 1 | 4 | 4* | - | - | - | - | 5.2 | 1 | 24 | 3 | 8.00 | 3-24 | - | - | 1 | - | - |
| Kanwal Park | 2 | 3 | 2 | 16 | 15 | 16.00 | - | - | - | 13 | 1 | 54 | 4 | 13.50 | 3-16 | - | - | 1 | - | - |
| Kariong | 1 | 1 | 1 | 5 | 5* | - | - | - | - | - | - | - | - | - | - | - | - | - | - | - |
| Kurraba | 2 | 2 | 1 | 7 | 7* | 7.00 | - | - | - | 11 | 3 | 31 | 1 | 31.00 | 1-11 | - | - | - | - | - |
| Lakehaven | 1 | - | - | - | - | - | - | - | - | - | - | - | - | - | - | - | - | - | - | - |
| Lisarow Sporting Field | 1 | 2 | - | - | - | - | - | - | - | 9 | - | 26 | - | - | 0-26 | - | - | - | - | - |
| Maidens Brush | 4 | 4 | 1 | 45 | 23* | 15.00 | - | - | - | 32 | 3 | 120 | 7 | 17.14 | 4-12 | - | - | - | - | - |
| Mascord | 2 | 2 | 1 | 14 | 14 | 14.00 | - | - | - | 4 | 1 | 14 | - | - | 0-14 | - | - | - | - | 1 |
| Morrie Breen | 3 | 3 | 1 | 14 | 13* | 7.00 | - | - | - | 23.4 | 6 | 110 | 2 | 55.00 | 2-34 | - | - | - | - | - |
| North Lakes | 4 | 4 | 3 | 10 | 6* | 10.00 | - | - | - | 20 | 6 | 64 | - | - | 0-14 | - | - | - | - | - |
| Paddy Clifton No1 | 9 | 8 | 3 | 25 | 12* | 5.00 | - | - | - | 62 | 4 | 251 | 10 | 25.10 | 2-16 | - | - | 2 | - | - |
| Paddy Clifton No2 | 4 | 2 | 1 | 4 | 4 | 4.00 | - | - | - | 30 | 5 | 97 | 8 | 12.12 | 4-19 | - | - | 2 | - | - |
| Pat Morley | 1 | - | - | - | - | - | - | - | - | 5 | - | 16 | 2 | 8.00 | 2-16 | - | - | - | - | - |
| Paul Oval | 1 | 1 | 1 | 7 | 7* | - | - | - | - | 5 | - | 22 | - | - | 0-22 | - | - | - | - | - |
| Saratoga Oval | 2 | 3 | 1 | 6 | 6 | 3.00 | - | - | - | 14 | 4 | 54 | 4 | 13.50 | 3-41 | - | - | - | - | - |
| Sohier Park | 1 | - | - | - | - | - | - | - | - | 7 | 1 | 24 | 2 | 12.00 | 2-24 | - | - | 1 | - | - |
| Sohier Park # 3 | 2 | 3 | 2 | - | 0* | - | - | - | - | 24 | 2 | 110 | 2 | 55.00 | 1-29 | - | - | - | - | - |
| St Edwards | 1 | - | - | - | - | - | - | - | - | 3 | - | 19 | - | - | 0-19 | - | - | - | - | - |
| Tacoma | 1 | 1 | 1 | 3 | 3* | - | - | - | - | 17 | 3 | 39 | 3 | 13.00 | 2-21 | - | - | - | - | - |
| Taylor Park | 1 | 1 | 1 | 4 | 4* | - | - | - | - | 9 | 2 | 43 | 2 | 21.50 | 2-25 | - | - | 1 | - | - |
| Terrigal Haven | 1 | 1 | 1 | 18 | 18* | - | - | - | - | 5 | - | 27 | 1 | 27.00 | 1-27 | - | - | - | - | - |
| Tunkuwallin | 1 | - | - | - | - | - | - | - | - | 7 | 3 | 13 | - | - | 0-13 | - | - | - | - | - |
| Woy Woy #2 | 1 | 1 | - | 10 | 10 | 10.00 | - | - | - | 8 | - | 28 | - | - | 0-28 | - | - | - | - | - |
Stats by Cricket Statz | Last updated 27-Apr-2025.