Garry Crowe
All Matches, All Grades, Narara, 02-Nov-1935 to 15-Mar-2025
The Var is the variance of the scores to the mean. It is a measure of how reliable the batsman is at reaching their average. A low variance indicates the batsman will often get scores close to his average. A high variance indicates his scores are fairly unpredictable.
| Mat | Cts | ROs | Sts | GFs | GFWon |
|---|---|---|---|---|---|
| 212 | 156 | 11 | 10 | 4 | 2 |
Results by Season
| Season | Mat | Inn | NO | Runs | HS | Ave | SR | 100 | 50 | Overs | Maid | RunsA | Wkts | Ave | Best | 10W | 5WI | Cts | Sts | ROs |
|---|---|---|---|---|---|---|---|---|---|---|---|---|---|---|---|---|---|---|---|---|
| 2007/08 | 8 | 9 | 1 | 33 | 10 | 4.12 | - | - | - | 48 | 6 | 168 | 8 | 21.00 | 3-45 | - | - | 5 | - | - |
| 2008/09 | 12 | 13 | 1 | 584 | 115 | 48.67 | - | 1 | 2 | 57 | 10 | 215 | 11 | 19.55 | 4-56 | - | - | 7 | - | 1 |
| 2009/10 | 10 | 10 | - | 226 | 78 | 22.60 | - | - | 1 | 2.4 | 1 | 2 | 2 | 1.00 | 1-0 | - | - | 5 | - | - |
| 2010/11 | 12 | 12 | - | 188 | 49 | 15.67 | - | - | - | 22.3 | 3 | 75 | 3 | 25.00 | 1-0 | - | - | 14 | - | - |
| 2011/12 | 11 | 10 | 3 | 234 | 100* | 33.43 | - | 1 | 1 | - | - | - | - | - | - | - | - | 8 | - | - |
| 2012/13 | 13 | 8 | - | 106 | 44 | 13.25 | - | - | - | 3 | 1 | 6 | - | - | 0-0 | - | - | 24 | - | - |
| 2013/14 | 13 | 11 | 2 | 116 | 53 | 12.89 | - | - | 1 | 20 | 2 | 84 | 4 | 21.00 | 4-21 | - | - | 9 | - | - |
| 2014/15 | 16 | 15 | - | 172 | 36 | 11.47 | - | - | - | 2 | - | 14 | - | - | 0-14 | - | - | 20 | 3 | 4 |
| 2015/16 | 11 | 13 | 2 | 177 | 39* | 16.09 | - | - | - | 9 | 2 | 34 | 2 | 17.00 | 2-16 | - | - | 4 | 1 | - |
| 2016/17 | 14 | 12 | 1 | 118 | 35 | 10.73 | - | - | - | 26.3 | 4 | 113 | 2 | 56.50 | 1-24 | - | - | 4 | 1 | 1 |
| 2017/18 | 7 | 8 | - | 96 | 22 | 12.00 | - | - | - | 7 | - | 40 | - | - | 0-16 | - | - | 8 | - | - |
| 2018/19 | 18 | 15 | 4 | 151 | 52* | 13.73 | - | - | 1 | 8 | - | 31 | 1 | 31.00 | 1-31 | - | - | 13 | - | 1 |
| 2019/20 | 9 | 5 | 1 | 24 | 13 | 6.00 | - | - | - | 12 | 2 | 70 | 4 | 17.50 | 2-16 | - | - | 3 | - | - |
| 2020/21 | 12 | 11 | - | 131 | 41 | 11.91 | - | - | - | 8 | - | 33 | 2 | 16.50 | 1-8 | - | - | 5 | - | - |
| 2021/22 | 5 | 3 | - | 17 | 17 | 5.67 | - | - | - | 1 | - | 2 | - | - | 0-2 | - | - | 1 | - | - |
| 2022/23 | 16 | 12 | 2 | 121 | 51* | 12.10 | - | - | 1 | - | - | - | - | - | - | - | - | 11 | 2 | 2 |
| 2023/24 | 15 | 12 | 1 | 173 | 51 | 15.73 | - | - | 2 | 3 | - | 4 | - | - | 0-4 | - | - | 7 | 1 | - |
| 2024/25 | 10 | 6 | 1 | 54 | 30 | 10.80 | - | - | - | 1 | - | 9 | - | - | 0-9 | - | - | 8 | 2 | 2 |
Results by Grade
| Grade | Mat | Inn | NO | Runs | HS | Ave | SR | 100 | 50 | Overs | Maid | RunsA | Wkts | Ave | Best | 10W | 5WI | Cts | Sts | ROs |
|---|---|---|---|---|---|---|---|---|---|---|---|---|---|---|---|---|---|---|---|---|
| 2nd Grade | 5 | 3 | - | 13 | 8 | 4.33 | - | - | - | - | - | - | - | - | - | - | - | 2 | - | - |
| 3rd Grade | 25 | 26 | 2 | 470 | 78 | 19.58 | - | - | 1 | 19.4 | 4 | 76 | 6 | 12.67 | 2-16 | - | - | 15 | - | - |
| 4th Grade | 41 | 41 | 2 | 408 | 49 | 10.46 | - | - | - | 95 | 13 | 350 | 13 | 26.92 | 3-45 | - | - | 24 | 1 | 1 |
| 5th Grade | 31 | 26 | 2 | 642 | 115 | 26.75 | - | 1 | 1 | 65 | 11 | 265 | 15 | 17.67 | 4-56 | - | - | 13 | 1 | 1 |
| 6th Grade | 6 | 6 | - | 70 | 41 | 11.67 | - | - | - | 8 | - | 42 | - | - | 0-2 | - | - | 5 | - | - |
| 7th Grade | 39 | 30 | 5 | 387 | 59 | 15.48 | - | - | 4 | 18 | - | 63 | 1 | 63.00 | 1-31 | - | - | 28 | 3 | 3 |
| 8th Grade | 11 | 8 | 2 | 102 | 51* | 17.00 | - | - | 1 | - | - | - | - | - | - | - | - | 8 | 2 | 2 |
| CCCA T20 | 1 | 1 | 1 | 1 | 1* | - | - | - | - | - | - | - | - | - | - | - | - | - | - | - |
| Division 1 | 1 | 1 | - | 3 | 3 | 3.00 | - | - | - | - | - | - | - | - | - | - | - | 2 | - | - |
| Division 2 | 1 | 1 | - | - | - | - | - | - | - | - | - | - | - | - | - | - | - | - | - | - |
| Division 3 | 50 | 41 | 5 | 587 | 100* | 16.31 | - | 1 | 2 | 25 | 3 | 104 | 4 | 26.00 | 4-21 | - | - | 57 | 3 | 4 |
| Division 4 | 1 | 1 | - | 38 | 38 | 38.00 | - | - | - | - | - | - | - | - | - | - | - | 2 | - | - |
Batting Statistics
| Inns | NOs | Runs | HS | Ave | Var% | 50s | 100s | 4s | 6s | Ret |
|---|---|---|---|---|---|---|---|---|---|---|
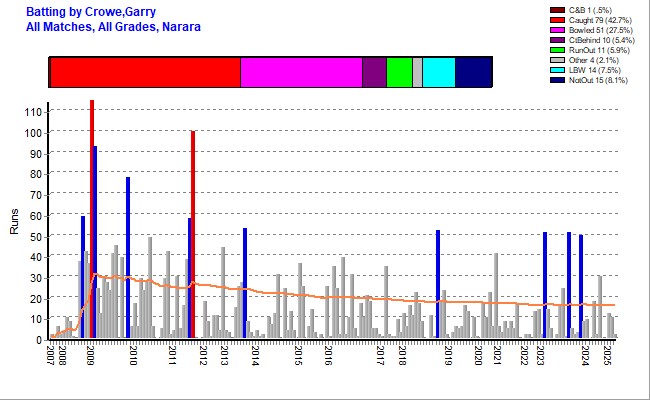
| 185 | 19 | 2721 | 115 Vs WCC 2008/09 | 16.39 | 112.06% | 9 | 2 | 275 | 29 | 4 |
Batting Highlights
| Score/s | Team | Vs | Ground | Grade | Date |
|---|---|---|---|---|---|
| 50* | Narara 7th | Southern Spirit | Alan Davidson | 7th Grade | 02-Dec-2023 |
| 51{ct} | Narara 7th | Lisarow | Sohier Park # 3 | 7th Grade | 28-Oct-2023 |
| 51* | Narara 8th White | Northern Power | Alan Davidson | 8th Grade | 04-Feb-2023 |
| 52* | Narara 7th | Lisarow | Alan Davidson | 7th Grade | 24-Nov-2018 |
| 53{ct} | Narara 3rd Divis | Umina | Carrington St | Division 3 | 26-Oct-2013 |
| 100* | Narara 3rd Divis | Woy Woy | Carrington St | Division 3 | 22-Oct-2011 |
| 58{ct} | Narara 3rd Divis | Warnervale | Carrington St | Division 3 | 08-Oct-2011 |
| 78{ct} | Narara 3rd | Mountains | Kariong | 3rd Grade | 28-Nov-2009 |
| 93{ct} | Narara 5th | Mountains | Alan Davidson | 5th Grade | 17-Jan-2009 |
| 115{b} | Narara 5th | Wyong | Kanwal Park | 5th Grade | 03-Jan-2009 |
| 59{b} | Narara 7th | Wyong | Paddy Clifton No1 | 7th Grade | 15-Nov-2008 |
Results by Batting Position
| Position | Inn | NO | Runs | HS | Ave | SR | 100 | 50 |
|---|---|---|---|---|---|---|---|---|
| Open | 75 | 6 | 1224 | 100* | 17.74 | - | 1 | 4 |
| 3 | 26 | 2 | 465 | 93 | 19.38 | - | - | 2 |
| 4 | 21 | 1 | 377 | 115 | 18.85 | - | 1 | - |
| 5 | 14 | 2 | 266 | 59 | 22.17 | - | - | 3 |
| 6 | 13 | - | 173 | 35 | 13.31 | - | - | - |
| 7 | 8 | - | 22 | 4 | 2.75 | - | - | - |
| 8 | 10 | 2 | 97 | 44 | 12.12 | - | - | - |
| 9 | 9 | 3 | 73 | 37* | 12.17 | - | - | - |
| 10 | 3 | 1 | 2 | 1* | 1.00 | - | - | - |
| 11 | 6 | 2 | 22 | 10* | 5.50 | - | - | - |
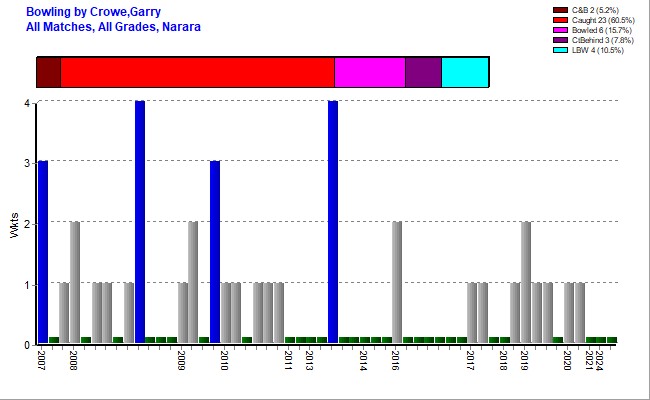
Bowling Statistics
| Overs | Maids | RunsA | Wkts | Best | Ave | 5WI | 10WM | Econ | SR |
|---|---|---|---|---|---|---|---|---|---|
| 230.4 | 31 | 900 | 39 | 4-21 Vs KCC 2013/14 | 23.08 | - | - | 3.90 | 35.49 |
First Match
| Batting | Bowling | Team | Vs | Ground | Date |
|---|---|---|---|---|---|
| 2{b} | Narara 4th | Gosford | Carrington St | 06-Oct-2007 |
Results by Opposition Team
| Opposition | Mat | Inn | NO | Runs | HS | Ave | SR | 100 | 50 | Overs | Maid | RunsA | Wkts | Ave | Best | 10W | 5WI | Cts | Sts | ROs |
|---|---|---|---|---|---|---|---|---|---|---|---|---|---|---|---|---|---|---|---|---|
| Brisbane Water | 15 | 13 | 1 | 156 | 31 | 13.00 | - | - | - | 5 | 1 | 16 | 2 | 8.00 | 2-16 | - | - | 8 | 3 | 1 |
| Doyalson | 2 | 2 | - | 52 | 29 | 26.00 | - | - | - | .3 | - | 2 | 1 | 2.00 | 1-2 | - | - | 1 | - | - |
| Gosford | 3 | 3 | - | 46 | 28 | 15.33 | - | - | - | 2.4 | 1 | 2 | 2 | 1.00 | 1-0 | - | - | 4 | - | - |
| Kincumber | 19 | 16 | 1 | 186 | 42 | 12.40 | - | - | - | 33.1 | 4 | 111 | 7 | 15.86 | 4-21 | - | - | 12 | 1 | 2 |
| Lisarow | 18 | 17 | 3 | 205 | 52* | 14.64 | - | - | 2 | 16.3 | 1 | 65 | 1 | 65.00 | 1-25 | - | - | 15 | - | - |
| Mountains | 6 | 6 | 1 | 217 | 93 | 43.40 | - | - | 2 | 13 | 4 | 43 | 1 | 43.00 | 1-43 | - | - | 2 | - | - |
| Narara 7th Green | 1 | 1 | - | 12 | 12 | 12.00 | - | - | - | - | - | - | - | - | - | - | - | 1 | - | - |
| Narara 8th Green | 1 | 1 | - | 2 | 2 | 2.00 | - | - | - | - | - | - | - | - | - | - | - | - | - | - |
| Northern Power | 22 | 18 | 2 | 160 | 51* | 10.00 | - | - | 1 | 3 | - | 18 | - | - | 0-2 | - | - | 10 | 4 | 1 |
| Southern Spirit | 13 | 9 | 1 | 163 | 50* | 20.38 | - | - | 1 | 10 | 1 | 44 | 1 | 44.00 | 1-34 | - | - | 8 | 1 | - |
| Terrigal-Matcham | 21 | 17 | 3 | 155 | 30 | 11.07 | - | - | - | 17.5 | 4 | 76 | 4 | 19.00 | 2-16 | - | - | 17 | 1 | 1 |
| The Entrance | 19 | 20 | 1 | 205 | 41 | 10.79 | - | - | - | 24 | 4 | 83 | 2 | 41.50 | 1-13 | - | - | 15 | - | - |
| Toukley | 8 | 8 | - | 176 | 49 | 22.00 | - | - | - | 25 | 5 | 103 | 8 | 12.88 | 3-5 | - | - | 4 | - | 1 |
| Umina | 7 | 7 | - | 71 | 53 | 10.14 | - | - | 1 | 11 | 1 | 66 | 2 | 33.00 | 2-20 | - | - | 6 | - | - |
| Warnervale | 24 | 18 | 2 | 300 | 58 | 18.75 | - | - | 1 | 26 | 3 | 120 | 5 | 24.00 | 4-56 | - | - | 18 | - | 4 |
| Woy Woy | 8 | 4 | 1 | 163 | 100* | 54.33 | - | 1 | - | 15 | 1 | 40 | 1 | 40.00 | 1-4 | - | - | 13 | - | - |
| Wyong | 25 | 25 | 3 | 452 | 115 | 20.55 | - | 1 | 1 | 28 | 1 | 111 | 2 | 55.50 | 1-28 | - | - | 22 | - | 1 |
Results by Ground
| Ground | Mat | Inn | NO | Runs | HS | Ave | SR | 100 | 50 | Overs | Maid | RunsA | Wkts | Ave | Best | 10W | 5WI | Cts | Sts | ROs |
|---|---|---|---|---|---|---|---|---|---|---|---|---|---|---|---|---|---|---|---|---|
| Adcock #3 | 6 | 6 | - | 76 | 22 | 12.67 | - | - | - | - | - | - | - | - | - | - | - | 2 | 2 | 2 |
| Adcock Park | 1 | 1 | - | 1 | 1 | 1.00 | - | - | - | 4 | 1 | 18 | - | - | 0-18 | - | - | - | - | - |
| Alan Davidson | 35 | 32 | 6 | 595 | 93 | 22.88 | - | - | 4 | 34 | 6 | 137 | 5 | 27.40 | 4-56 | - | - | 33 | - | 4 |
| Baker Park | 1 | - | - | - | - | - | - | - | - | - | - | - | - | - | - | - | - | - | - | - |
| Bill Sohier Park (Sohie | 1 | 1 | - | - | - | - | - | - | - | - | - | - | - | - | - | - | - | 2 | - | - |
| Blue Haven | 1 | - | - | - | - | - | - | - | - | - | - | - | - | - | - | - | - | 1 | - | - |
| Carrington St | 47 | 41 | 6 | 631 | 100* | 18.03 | - | 1 | 2 | 78.3 | 13 | 261 | 13 | 20.08 | 3-45 | - | - | 44 | - | - |
| Col Gooley Oval | 7 | 8 | - | 82 | 25 | 10.25 | - | - | - | 6 | - | 46 | - | - | 0-20 | - | - | 2 | - | - |
| Darren Kennedy | 2 | 1 | - | 8 | 8 | 8.00 | - | - | - | - | - | - | - | - | - | - | - | 1 | - | - |
| Don Small Oval | 3 | 3 | 1 | 16 | 14* | 8.00 | - | - | - | - | - | - | - | - | - | - | - | 3 | - | - |
| Doyalson #2 | 2 | 2 | 1 | 22 | 12 | 22.00 | - | - | - | - | - | - | - | - | - | - | - | 1 | 2 | 1 |
| Duffys Road | 1 | - | - | - | - | - | - | - | - | - | - | - | - | - | - | - | - | - | - | - |
| EDSACC North | 3 | 3 | - | 50 | 35 | 16.67 | - | - | - | - | - | - | - | - | - | - | - | 2 | - | - |
| EDSACC Sth | 3 | 3 | - | 105 | 41 | 35.00 | - | - | - | - | - | - | - | - | - | - | - | 1 | - | - |
| Fagans Park | 6 | 6 | - | 42 | 31 | 7.00 | - | - | - | 5 | 1 | 16 | 2 | 8.00 | 2-16 | - | - | 2 | - | - |
| Frost Reserve | 4 | 3 | - | 17 | 11 | 5.67 | - | - | - | 10.1 | - | 44 | 2 | 22.00 | 1-13 | - | - | 1 | - | 1 |
| Gavenlock Oval | 6 | 5 | - | 39 | 24 | 7.80 | - | - | - | - | - | - | - | - | - | - | - | - | - | - |
| Halekulani Oval | 5 | 5 | - | 74 | 45 | 14.80 | - | - | - | 5 | 1 | 24 | 3 | 8.00 | 3-5 | - | - | 5 | 1 | 1 |
| Hamlyn Terrace Oval [TB | 4 | 4 | - | 42 | 25 | 10.50 | - | - | - | - | - | - | - | - | - | - | - | 5 | - | - |
| Harry Moore | 4 | 1 | - | 30 | 30 | 30.00 | - | - | - | 7 | 1 | 41 | 2 | 20.50 | 2-34 | - | - | - | 1 | - |
| Hylton Moore | 3 | 2 | - | 46 | 30 | 23.00 | - | - | - | - | - | - | - | - | - | - | - | 3 | - | - |
| Jubilee Park | 1 | 1 | - | 3 | 3 | 3.00 | - | - | - | - | - | - | - | - | - | - | - | 2 | - | - |
| Kanwal Park | 4 | 4 | 1 | 160 | 115 | 53.33 | - | 1 | - | 4 | - | 28 | 1 | 28.00 | 1-28 | - | - | 2 | - | - |
| Kariong | 7 | 6 | 1 | 150 | 78 | 30.00 | - | - | 1 | 3 | 1 | 8 | 1 | 8.00 | 1-8 | - | - | 3 | 1 | 1 |
| Lisarow Sporting Field | 3 | 3 | - | 29 | 16 | 9.67 | - | - | - | 9 | - | 41 | 1 | 41.00 | 1-25 | - | - | 4 | - | - |
| Mandalong Oval | 3 | 4 | - | 45 | 27 | 11.25 | - | - | - | - | - | - | - | - | - | - | - | 3 | - | - |
| Mascord | 3 | 3 | - | 66 | 35 | 22.00 | - | - | - | 3 | - | 24 | 1 | 24.00 | 1-24 | - | - | 2 | - | - |
| McEvoy | 1 | 1 | - | - | - | - | - | - | - | - | - | - | - | - | - | - | - | - | - | - |
| McKillopOval | 4 | 3 | - | 13 | 8 | 4.33 | - | - | - | 9 | 2 | 21 | 4 | 5.25 | 4-21 | - | - | 5 | 1 | - |
| Morrie Breen | 1 | 1 | - | 3 | 3 | 3.00 | - | - | - | - | - | - | - | - | - | - | - | - | - | - |
| Mt Penang | 2 | 2 | - | 3 | 2 | 1.50 | - | - | - | 3 | - | 7 | - | - | 0-7 | - | - | - | - | - |
| North Lakes | 1 | 1 | - | - | - | - | - | - | - | 1 | - | 2 | - | - | 0-2 | - | - | - | - | - |
| Ozanam Oval | 1 | 1 | - | - | - | - | - | - | - | - | - | - | - | - | - | - | - | - | - | - |
| Paddy Clifton No1 | 3 | 3 | - | 68 | 59 | 22.67 | - | - | 1 | 6 | - | 19 | - | - | 0-19 | - | - | 2 | - | - |
| Pat Morley | 2 | 2 | - | 4 | 2 | 2.00 | - | - | - | - | - | - | - | - | - | - | - | 1 | - | - |
| Paul Oval | 5 | 5 | - | 66 | 25 | 13.20 | - | - | - | 1 | 1 | - | 1 | - | 1-0 | - | - | 4 | - | - |
| Rogers Park | 1 | 1 | - | 4 | 4 | 4.00 | - | - | - | - | - | - | - | - | - | - | - | 1 | - | - |
| Rogers Park #2 | 9 | 2 | - | 33 | 17 | 16.50 | - | - | - | 18 | 2 | 68 | 2 | 34.00 | 1-4 | - | - | 8 | 1 | - |
| Sohier Park | 3 | 2 | - | 3 | 2 | 1.50 | - | - | - | - | - | - | - | - | - | - | - | 3 | 1 | - |
| Sohier Park # 3 | 3 | 3 | - | 54 | 51 | 18.00 | - | - | 1 | - | - | - | - | - | - | - | - | 2 | - | - |
| Tacoma | 1 | 1 | - | - | - | - | - | - | - | 11 | 1 | 33 | 1 | 33.00 | 1-33 | - | - | 1 | - | - |
| Taylor Park | 1 | 1 | 1 | 39 | 39* | - | - | - | - | - | - | - | - | - | - | - | - | 2 | - | - |
| Terrigal Haven | 1 | 2 | - | 78 | 42 | 39.00 | - | - | - | 8 | 1 | 32 | - | - | 0-11 | - | - | 1 | - | - |
| Toukley #2 | 1 | 1 | - | - | - | - | - | - | - | - | - | - | - | - | - | - | - | - | - | - |
| Wadalba | 2 | 1 | - | 13 | 13 | 13.00 | - | - | - | 1 | - | 9 | - | - | 0-9 | - | - | - | - | - |
| Wadalba Sports Complex | 1 | 1 | 1 | 5 | 5* | - | - | - | - | - | - | - | - | - | - | - | - | 1 | - | - |
| Woongarrah Oval | 3 | 3 | 1 | 6 | 4 | 3.00 | - | - | - | 4 | - | 21 | - | - | 0-21 | - | - | 1 | - | 1 |
Stats by Cricket Statz | Last updated 27-Apr-2025.