Joel Stuckey
All Matches, All Grades, Narara, 02-Nov-1935 to 15-Mar-2025
The Var is the variance of the scores to the mean. It is a measure of how reliable the batsman is at reaching their average. A low variance indicates the batsman will often get scores close to his average. A high variance indicates his scores are fairly unpredictable.
| Mat | Cts | ROs | Sts | GFs | GFWon |
|---|---|---|---|---|---|
| 77 | 37 | - | - | 1 | - |
Results by Season
| Season | Mat | Inn | NO | Runs | HS | Ave | SR | 100 | 50 | Overs | Maid | RunsA | Wkts | Ave | Best | 10W | 5WI | Cts | Sts | ROs |
|---|---|---|---|---|---|---|---|---|---|---|---|---|---|---|---|---|---|---|---|---|
| 2007/08 | 11 | 18 | 1 | 311 | 60* | 18.29 | - | - | 2 | 99 | 20 | 344 | 11 | 31.27 | 5-31 | - | 1 | 2 | - | - |
| 2008/09 | 4 | 3 | - | 68 | 35 | 22.67 | - | - | - | 26 | 1 | 120 | 1 | 120.00 | 1-18 | - | - | 2 | - | - |
| 2010/11 | 11 | 11 | 2 | 433 | 83 | 48.11 | - | - | 4 | 85 | 8 | 330 | 16 | 20.62 | 3-19 | - | - | 7 | - | - |
| 2011/12 | 9 | 8 | 3 | 205 | 57* | 41.00 | - | - | 1 | 64.2 | 16 | 196 | 11 | 17.82 | 3-12 | - | - | 3 | - | - |
| 2012/13 | 14 | 16 | 2 | 599 | 130 | 42.79 | - | 1 | 4 | 39 | 10 | 117 | 9 | 13.00 | 3-14 | - | - | 11 | - | - |
| 2013/14 | 13 | 14 | 1 | 380 | 86 | 29.23 | - | - | 4 | 9.2 | - | 51 | 1 | 51.00 | 1-18 | - | - | 7 | - | - |
| 2014/15 | 14 | 14 | 1 | 244 | 40* | 18.77 | - | - | - | 1 | - | 8 | - | - | 0-8 | - | - | 5 | - | - |
| 2015/16 | 1 | 1 | - | 8 | 8 | 8.00 | - | - | - | - | - | - | - | - | - | - | - | - | - | - |
Results by Grade
| Grade | Mat | Inn | NO | Runs | HS | Ave | SR | 100 | 50 | Overs | Maid | RunsA | Wkts | Ave | Best | 10W | 5WI | Cts | Sts | ROs |
|---|---|---|---|---|---|---|---|---|---|---|---|---|---|---|---|---|---|---|---|---|
| 3rd Grade | 1 | 1 | - | 8 | 8 | 8.00 | - | - | - | - | - | - | - | - | - | - | - | - | - | - |
| 5th Grade | 11 | 12 | 1 | 402 | 83 | 36.55 | - | - | 4 | 84 | 9 | 331 | 15 | 22.07 | 3-19 | - | - | 6 | - | - |
| 6th Grade | 11 | 17 | 2 | 342 | 60* | 22.80 | - | - | 2 | 100 | 19 | 343 | 12 | 28.58 | 5-31 | - | 1 | 3 | - | - |
| 7th Grade | 1 | - | - | - | - | - | - | - | - | 4 | - | 28 | - | - | 0-28 | - | - | - | - | - |
| 8th Grade | 3 | 3 | - | 68 | 35 | 22.67 | - | - | - | 22 | 1 | 92 | 1 | 92.00 | 1-18 | - | - | 2 | - | - |
| Division 1 | 27 | 29 | 1 | 614 | 86 | 21.93 | - | - | 4 | 2 | - | 16 | - | - | 0-8 | - | - | 9 | - | - |
| Division 3 | 20 | 20 | 5 | 681 | 130 | 45.40 | - | 1 | 4 | 80.2 | 22 | 250 | 13 | 19.23 | 3-12 | - | - | 17 | - | - |
| Division 4 | 3 | 3 | 1 | 133 | 57* | 66.50 | - | - | 1 | 31.2 | 4 | 106 | 8 | 13.25 | 3-17 | - | - | - | - | - |
Batting Statistics
| Inns | NOs | Runs | HS | Ave | Var% | 50s | 100s | 4s | 6s | Ret |
|---|---|---|---|---|---|---|---|---|---|---|
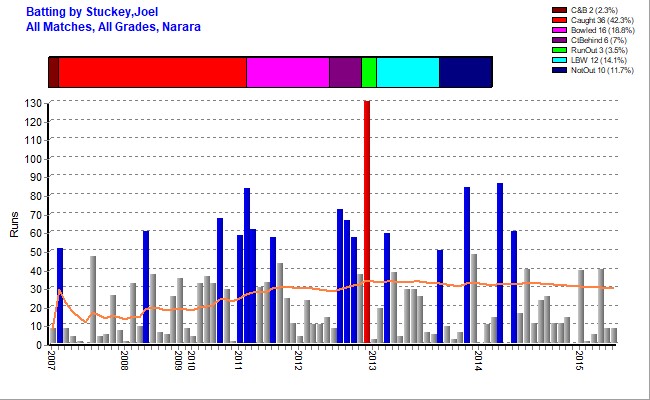
| 85 | 10 | 2248 | 130 Vs WCC 2012/13 | 29.97 | 85.13% | 15 | 1 | 203 | 35 | - |
Batting Highlights
| Score/s | Team | Vs | Ground | Grade | Date |
|---|---|---|---|---|---|
| 60{b} | Narara 1st Divis | Terrigal-Matcham | Duffys Road | Division 1 | 08-Feb-2014 |
| 86{ct} | Narara 1st Divis | Woy Woy | Rogers Park | Division 1 | 25-Jan-2014 |
| 84* | Narara 3rd Divis | Brisbane Water | Fagans Park | Division 3 | 30-Nov-2013 |
| 50{b} | Narara 1st Divis | Woy Woy | Gavenlock Oval | Division 1 | 12-Oct-2013 |
| 59{lb} | Narara 1st Divis | Umina | Col Gooley Oval | Division 1 | 19-Jan-2013 |
| 130{ct} | Narara 3rd Divis | Wyong | Carrington St | Division 3 | 15-Dec-2012 |
| 57* | Narara 3rd Divis | Lisarow | Carrington St | Division 3 | 17-Nov-2012 |
| 66{ct} | Narara 3rd Divis | Umina | Carrington St | Division 3 | 10-Nov-2012 |
| 72{ct} | Narara 3rd Divis | The Entrance | EDSACC North | Division 3 | 27-Oct-2012 |
| 57* | Narara 4th Divis | Kincumber | Carrington St | Division 4 | 05-Nov-2011 |
| 61{ct} | Narara 5th | Woy Woy | Woy Woy #2 | 5th Grade | 12-Feb-2011 |
| 83{ct} | Narara 5th | Warnervale | Tunkuwallin | 5th Grade | 29-Jan-2011 |
| 58{ct} | Narara 5th | Umina | Alan Davidson | 5th Grade | 15-Jan-2011 |
| 67* | Narara 5th | Doyalson | Alan Davidson | 5th Grade | 27-Nov-2010 |
| 60* | Narara 6th | Lisarow | Alan Davidson | 6th Grade | 19-Jan-2008 |
| 51{ct} | Narara 6th | Gosford | Alan Davidson | 6th Grade | 06-Oct-2007 |
Results by Batting Position
| Position | Inn | NO | Runs | HS | Ave | SR | 100 | 50 |
|---|---|---|---|---|---|---|---|---|
| Open | 32 | 2 | 685 | 86 | 22.83 | - | - | 3 |
| 3 | 30 | 5 | 1167 | 130 | 46.68 | - | 1 | 9 |
| 4 | 9 | 1 | 139 | 60* | 17.38 | - | - | 1 |
| 5 | 5 | 1 | 115 | 50 | 28.75 | - | - | 1 |
| 6 | 5 | - | 97 | 59 | 19.40 | - | - | 1 |
| 7 | 3 | 1 | 41 | 23* | 20.50 | - | - | - |
| 9 | 1 | - | 4 | 4 | 4.00 | - | - | - |
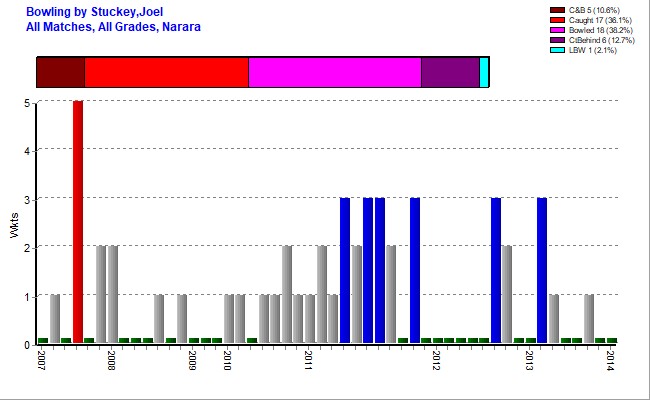
Bowling Statistics
| Overs | Maids | RunsA | Wkts | Best | Ave | 5WI | 10WM | Econ | SR |
|---|---|---|---|---|---|---|---|---|---|
| 323.4 | 55 | 1166 | 49 | 5-31 Vs WWCC 2007/08 | 23.80 | 1 | - | 3.60 | 39.63 |
Bowling Highlights
| O-M-R-W | Team | Vs | Ground | Grade | Date |
|---|---|---|---|---|---|
| 16-7-31-5 | Narara 6th | Woy Woy | Woy Woy #2 | 6th Grade | 17-Nov-2007 |
First Match
| Batting | Bowling | Team | Vs | Ground | Date |
|---|---|---|---|---|---|
| 8{ct},51{ct} | 0-2 | Narara 6th | Gosford | Alan Davidson | 06-Oct-2007 |
Results by Opposition Team
| Opposition | Mat | Inn | NO | Runs | HS | Ave | SR | 100 | 50 | Overs | Maid | RunsA | Wkts | Ave | Best | 10W | 5WI | Cts | Sts | ROs |
|---|---|---|---|---|---|---|---|---|---|---|---|---|---|---|---|---|---|---|---|---|
| Brisbane Water | 5 | 5 | 2 | 183 | 84* | 61.00 | - | - | 1 | 6 | - | 33 | - | - | 0-8 | - | - | 3 | - | - |
| Doyalson | 2 | 2 | 1 | 104 | 67* | 104.00 | - | - | 1 | 14 | 2 | 66 | 1 | 66.00 | 1-17 | - | - | - | - | - |
| Gosford | 4 | 5 | - | 140 | 51 | 28.00 | - | - | 1 | 16 | 1 | 78 | 2 | 39.00 | 2-2 | - | - | 2 | - | - |
| Kincumber | 11 | 11 | 1 | 259 | 57* | 25.90 | - | - | 1 | 38 | 4 | 160 | 7 | 22.86 | 3-14 | - | - | 3 | - | - |
| Lisarow | 10 | 14 | 2 | 252 | 60* | 21.00 | - | - | 2 | 64 | 14 | 238 | 6 | 39.67 | 2-16 | - | - | 2 | - | - |
| Mountains | 3 | 2 | - | 33 | 29 | 16.50 | - | - | - | 13 | - | 42 | 2 | 21.00 | 2-36 | - | - | 5 | - | - |
| Northern Power | 5 | 5 | - | 38 | 16 | 7.60 | - | - | - | 4.2 | - | 26 | 1 | 26.00 | 1-18 | - | - | 8 | - | - |
| Southern Spirit | 2 | 2 | - | 51 | 40 | 25.50 | - | - | - | - | - | - | - | - | - | - | - | 1 | - | - |
| Terrigal-Matcham | 6 | 8 | 1 | 154 | 60 | 22.00 | - | - | 1 | 22 | 9 | 46 | 4 | 11.50 | 3-27 | - | - | 3 | - | - |
| The Entrance | 7 | 7 | 1 | 148 | 72 | 24.67 | - | - | 1 | 25 | 5 | 63 | 2 | 31.50 | 1-15 | - | - | 3 | - | - |
| Toukley | 5 | 6 | 1 | 83 | 38 | 16.60 | - | - | - | 31 | 6 | 119 | 2 | 59.50 | 1-19 | - | - | 1 | - | - |
| Umina | 4 | 5 | 1 | 226 | 66 | 56.50 | - | - | 3 | 18 | 4 | 62 | 4 | 15.50 | 3-12 | - | - | 1 | - | - |
| Warnervale | 1 | 1 | - | 83 | 83 | 83.00 | - | - | 1 | 10 | - | 39 | 3 | 13.00 | 2-23 | - | - | 2 | - | - |
| Woy Woy | 7 | 8 | - | 317 | 86 | 39.62 | - | - | 3 | 54.2 | 10 | 145 | 15 | 9.67 | 5-31 | - | 1 | 2 | - | - |
| Wyong | 5 | 4 | - | 177 | 130 | 44.25 | - | 1 | - | 8 | - | 49 | - | - | 0-24 | - | - | 1 | - | - |
Results by Ground
| Ground | Mat | Inn | NO | Runs | HS | Ave | SR | 100 | 50 | Overs | Maid | RunsA | Wkts | Ave | Best | 10W | 5WI | Cts | Sts | ROs |
|---|---|---|---|---|---|---|---|---|---|---|---|---|---|---|---|---|---|---|---|---|
| Adcock #7 | 1 | 1 | - | 8 | 8 | 8.00 | - | - | - | 10 | 1 | 50 | - | - | 0-50 | - | - | 1 | - | - |
| Adcock Park | 1 | 1 | - | 5 | 5 | 5.00 | - | - | - | - | - | - | - | - | - | - | - | 1 | - | - |
| Alan Davidson | 10 | 15 | 2 | 369 | 67* | 28.38 | - | - | 4 | 83 | 17 | 280 | 9 | 31.11 | 2-2 | - | - | 3 | - | - |
| Baker Park | 1 | 1 | - | 1 | 1 | 1.00 | - | - | - | - | - | - | - | - | - | - | - | - | - | - |
| Bloodtree Road | 1 | 1 | - | 29 | 29 | 29.00 | - | - | - | 11 | - | 36 | 2 | 18.00 | 2-36 | - | - | 1 | - | - |
| Blue Haven | 1 | 1 | - | 37 | 37 | 37.00 | - | - | - | 9 | 1 | 49 | - | - | 0-49 | - | - | - | - | - |
| Carrington St | 11 | 11 | 3 | 447 | 130 | 55.88 | - | 1 | 3 | 52.2 | 14 | 149 | 11 | 13.55 | 3-12 | - | - | 10 | - | - |
| Col Gooley Oval | 2 | 3 | - | 118 | 59 | 39.33 | - | - | 1 | - | - | - | - | - | - | - | - | 1 | - | - |
| Darren Kennedy | 2 | 3 | - | 5 | 4 | 1.67 | - | - | - | 13 | 2 | 57 | 1 | 57.00 | 1-41 | - | - | 1 | - | - |
| Duffys Road | 2 | 2 | - | 68 | 60 | 34.00 | - | - | 1 | - | - | - | - | - | - | - | - | - | - | - |
| EDSACC North | 2 | 2 | - | 82 | 72 | 41.00 | - | - | 1 | 5 | 3 | 7 | - | - | 0-0 | - | - | 2 | - | - |
| Erina | 2 | 2 | - | 34 | 25 | 17.00 | - | - | - | - | - | - | - | - | - | - | - | - | - | - |
| Fagans Park | 2 | 2 | 1 | 132 | 84* | 132.00 | - | - | 1 | 5 | - | 25 | - | - | 0-25 | - | - | - | - | - |
| Gavenlock Oval | 13 | 16 | 1 | 235 | 50 | 15.67 | - | - | 1 | 1 | - | 8 | - | - | 0-8 | - | - | 4 | - | - |
| Hamlyn Terrace Oval [TB | 3 | 3 | 1 | 83 | 29* | 41.50 | - | - | - | 16 | 4 | 51 | 4 | 12.75 | 3-14 | - | - | - | - | - |
| Harry Moore | 3 | 2 | - | 27 | 16 | 13.50 | - | - | - | 11 | 2 | 51 | - | - | 0-8 | - | - | 3 | - | - |
| Hasslett Oval | 1 | 1 | - | 36 | 36 | 36.00 | - | - | - | 8 | - | 47 | - | - | 0-47 | - | - | - | - | - |
| Jubilee Park | 2 | 1 | - | - | - | - | - | - | - | - | - | - | - | - | - | - | - | - | - | - |
| Kariong | 1 | 1 | - | 4 | 4 | 4.00 | - | - | - | 1 | - | 4 | - | - | 0-4 | - | - | 3 | - | - |
| Kurraba | 1 | 2 | - | 33 | 26 | 16.50 | - | - | - | 12 | 1 | 55 | 2 | 27.50 | 2-55 | - | - | - | - | - |
| Lakehaven | 1 | - | - | - | - | - | - | - | - | 5 | - | 25 | - | - | 0-25 | - | - | - | - | - |
| McKillopOval | 1 | 1 | - | 37 | 37 | 37.00 | - | - | - | - | - | - | - | - | - | - | - | 2 | - | - |
| Paddy Clifton No1 | 1 | 2 | - | 12 | 8 | 6.00 | - | - | - | 5 | - | 21 | 1 | 21.00 | 1-21 | - | - | - | - | - |
| Paddy Clifton No2 | 3 | 3 | 1 | 92 | 35 | 46.00 | - | - | - | 17 | - | 57 | 2 | 28.50 | 1-15 | - | - | 2 | - | - |
| Paul Oval | 1 | 1 | 1 | 23 | 23* | - | - | - | - | - | - | - | - | - | - | - | - | - | - | - |
| Rogers Park | 1 | 1 | - | 86 | 86 | 86.00 | - | - | 1 | - | - | - | - | - | - | - | - | - | - | - |
| Rogers Park #2 | 2 | 2 | - | 43 | 33 | 21.50 | - | - | - | 22.2 | 3 | 77 | 6 | 12.83 | 3-17 | - | - | - | - | - |
| Saratoga Oval | 1 | - | - | - | - | - | - | - | - | 4 | - | 28 | - | - | 0-28 | - | - | - | - | - |
| Sohier Park | 1 | 1 | - | 11 | 11 | 11.00 | - | - | - | - | - | - | - | - | - | - | - | - | - | - |
| Tunkuwallin | 1 | 1 | - | 83 | 83 | 83.00 | - | - | 1 | 10 | - | 39 | 3 | 13.00 | 2-23 | - | - | 2 | - | - |
| Woy Woy #2 | 2 | 2 | - | 108 | 61 | 54.00 | - | - | 1 | 23 | 7 | 50 | 8 | 6.25 | 5-31 | - | 1 | 1 | - | - |
Stats by Cricket Statz | Last updated 27-Apr-2025.