Geoffrey Christy
All Matches, All Grades, Narara, 02-Nov-1935 to 15-Mar-2025
The Var is the variance of the scores to the mean. It is a measure of how reliable the batsman is at reaching their average. A low variance indicates the batsman will often get scores close to his average. A high variance indicates his scores are fairly unpredictable.
| Mat | Cts | ROs | Sts | GFs | GFWon |
|---|---|---|---|---|---|
| 290 | 187 | 17 | - | 5 | 3 |
Results by Season
| Season | Mat | Inn | NO | Runs | HS | Ave | SR | 100 | 50 | Overs | Maid | RunsA | Wkts | Ave | Best | 10W | 5WI | Cts | Sts | ROs |
|---|---|---|---|---|---|---|---|---|---|---|---|---|---|---|---|---|---|---|---|---|
| 2003/04 | 13 | 12 | 3 | 153 | 44* | 17.00 | - | - | - | 118.1 | 28 | 346 | 12 | 28.83 | 3-43 | - | - | 7 | - | 1 |
| 2004/05 | 11 | 10 | 2 | 125 | 19* | 15.62 | - | - | - | 145.2 | 40 | 323 | 24 | 13.46 | 5-31 | - | 1 | 8 | - | 2 |
| 2005/06 | 11 | 15 | 1 | 314 | 51 | 22.43 | - | - | 1 | 158 | 43 | 387 | 21 | 18.43 | 4-17 | - | - | 15 | - | - |
| 2006/07 | 10 | 14 | 2 | 229 | 63 | 19.08 | - | - | 1 | 114 | 28 | 284 | 21 | 13.52 | 5-34 | - | 2 | 10 | - | - |
| 2007/08 | 8 | 10 | 2 | 111 | 26 | 13.88 | - | - | - | 84.4 | 18 | 202 | 15 | 13.47 | 5-51 | - | 1 | 8 | - | 2 |
| 2008/09 | 14 | 13 | 5 | 273 | 56* | 34.12 | - | - | 1 | 187 | 55 | 437 | 31 | 14.10 | 6-33 | - | 1 | 11 | - | - |
| 2009/10 | 10 | 12 | 2 | 99 | 18 | 9.90 | - | - | - | 63 | 11 | 266 | 11 | 24.18 | 5-32 | - | 1 | 8 | - | - |
| 2010/11 | 12 | 11 | 3 | 151 | 40 | 18.88 | - | - | - | 47.5 | 9 | 161 | 15 | 10.73 | 4-14 | - | - | 7 | - | - |
| 2011/12 | 11 | 10 | 5 | 75 | 36* | 15.00 | - | - | - | 81 | 20 | 226 | 12 | 18.83 | 3-13 | - | - | 13 | - | 1 |
| 2012/13 | 11 | 15 | 7 | 233 | 34 | 29.12 | - | - | - | 16.5 | - | 97 | 3 | 32.33 | 1-2 | - | - | 9 | - | - |
| 2013/14 | 13 | 11 | 3 | 174 | 62* | 21.75 | - | - | 1 | 98.5 | 18 | 273 | 16 | 17.06 | 5-19 | - | 1 | 12 | - | 2 |
| 2014/15 | 14 | 14 | 3 | 250 | 50 | 22.73 | - | - | 1 | 119 | 27 | 410 | 21 | 19.52 | 4-23 | - | - | 12 | - | 1 |
| 2015/16 | 14 | 13 | 1 | 212 | 52 | 17.67 | - | - | 1 | 142.1 | 35 | 448 | 34 | 13.18 | 5-29 | - | 1 | 7 | - | 1 |
| 2016/17 | 3 | 3 | - | 42 | 36 | 14.00 | - | - | - | 13 | - | 76 | 3 | 25.33 | 2-30 | - | - | 1 | - | 1 |
| 2017/18 | 14 | 15 | 6 | 164 | 31* | 18.22 | - | - | - | 94 | 20 | 287 | 18 | 15.94 | 3-18 | - | - | 9 | - | - |
| 2018/19 | 12 | 15 | - | 355 | 92 | 23.67 | - | - | 2 | 134 | 30 | 331 | 16 | 20.69 | 5-18 | - | 1 | 7 | - | 1 |
| 2019/20 | 15 | 15 | - | 432 | 107 | 28.80 | - | 1 | 3 | 70 | 11 | 234 | 19 | 12.32 | 4-14 | - | - | 4 | - | - |
| 2020/21 | 15 | 15 | - | 198 | 51 | 13.20 | - | - | 1 | 39.2 | 5 | 147 | 6 | 24.50 | 2-13 | - | - | 6 | - | 1 |
| 2021/22 | 19 | 15 | 1 | 265 | 38 | 18.93 | - | - | - | 38.2 | 8 | 139 | 12 | 11.58 | 4-8 | - | - | 10 | - | - |
| 2022/23 | 21 | 15 | 1 | 74 | 13 | 5.29 | - | - | - | 84.3 | 12 | 372 | 18 | 20.67 | 3-33 | - | - | 10 | - | - |
| 2023/24 | 20 | 12 | 2 | 67 | 25 | 6.70 | - | - | - | 123.4 | 19 | 459 | 23 | 19.96 | 3-12 | - | - | 9 | - | 2 |
| 2024/25 | 19 | 12 | 5 | 40 | 12 | 5.71 | - | - | - | 115.4 | 18 | 347 | 22 | 15.77 | 4-30 | - | - | 4 | - | 2 |
Results by Grade
| Grade | Mat | Inn | NO | Runs | HS | Ave | SR | 100 | 50 | Overs | Maid | RunsA | Wkts | Ave | Best | 10W | 5WI | Cts | Sts | ROs |
|---|---|---|---|---|---|---|---|---|---|---|---|---|---|---|---|---|---|---|---|---|
| 2nd Grade | 7 | 5 | 2 | 18 | 12 | 6.00 | - | - | - | 55 | 12 | 183 | 8 | 22.88 | 3-39 | - | - | 5 | - | - |
| 3rd Grade | 75 | 60 | 10 | 553 | 38 | 11.06 | - | - | - | 310.1 | 49 | 1178 | 63 | 18.70 | 5-32 | - | 1 | 37 | - | 1 |
| 4th Grade | 42 | 47 | 10 | 583 | 63 | 15.76 | - | - | 2 | 350.5 | 76 | 981 | 66 | 14.86 | 5-34 | - | 2 | 29 | - | 2 |
| 5th Grade | 65 | 70 | 12 | 1161 | 56* | 20.02 | - | - | 3 | 709.1 | 180 | 1926 | 122 | 15.79 | 6-33 | - | 4 | 48 | - | 5 |
| 6th Grade | 34 | 37 | - | 885 | 107 | 23.92 | - | 1 | 5 | 284.1 | 70 | 723 | 45 | 16.07 | 5-18 | - | 1 | 15 | - | 1 |
| 7th Grade | 2 | 2 | - | 6 | 6 | 3.00 | - | - | - | 10 | - | 46 | 1 | 46.00 | 1-23 | - | - | 1 | - | - |
| 8th Grade | 1 | 1 | 1 | 39 | 39* | - | - | - | - | 6 | - | 17 | - | - | 0-17 | - | - | 1 | - | - |
| 9th Grade | 1 | 1 | - | 36 | 36 | 36.00 | - | - | - | 3 | - | 30 | 2 | 15.00 | 2-30 | - | - | - | - | 1 |
| CCCA T20 | 2 | - | - | - | - | - | - | - | - | 4 | - | 25 | 1 | 25.00 | 1-17 | - | - | 1 | - | - |
| Division 4 | 36 | 39 | 15 | 558 | 50 | 23.25 | - | - | 1 | 216.5 | 47 | 733 | 36 | 20.36 | 4-23 | - | - | 34 | - | 2 |
| Division 5 | 13 | 11 | 3 | 174 | 62* | 21.75 | - | - | 1 | 98.5 | 18 | 273 | 16 | 17.06 | 5-19 | - | 1 | 12 | - | 2 |
| Masters | 12 | 4 | 1 | 23 | 12 | 7.67 | - | - | - | 40.2 | 3 | 137 | 13 | 10.54 | 3-12 | - | - | 4 | - | 3 |
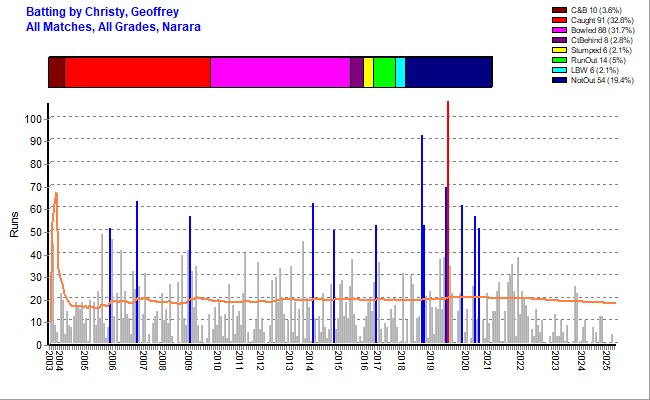
Batting Statistics
| Inns | NOs | Runs | HS | Ave | Var% | 50s | 100s | 4s | 6s | Ret |
|---|---|---|---|---|---|---|---|---|---|---|
| 277 | 54 | 4036 | 107 Vs NPCC 2019/20 | 18.10 | 91.50% | 12 | 1 | 393 | 46 | - |
Batting Highlights
| Score/s | Team | Vs | Ground | Grade | Date |
|---|---|---|---|---|---|
| 51{b} | Narara 4th | Southern Spirit | Col Gooley Oval | 4th Grade | 14-Nov-2020 |
| 56{ct} | Narara 6th | Wyong | Blue Haven | 6th Grade | 29-Feb-2020 |
| 61{ct} | Narara 6th | Terrigal-Matcham | Alan Davidson | 6th Grade | 14-Dec-2019 |
| 107{b} | Narara 6th | Northern Power | Tunkuwallin | 6th Grade | 26-Oct-2019 |
| 69{ct} | Narara 6th | Lisarow | Alan Davidson | 6th Grade | 19-Oct-2019 |
| 52{b} | Narara 6th | Northern Power | Carrington St | 6th Grade | 24-Nov-2018 |
| 92{ct} | Narara 6th | Warnervale | Hamlyn Terrace Oval [TBA | 6th Grade | 10-Nov-2018 |
| 52{ct} | Narara 5th | Warnervale | Mascord | 5th Grade | 27-Feb-2016 |
| 50{ct} | Narara 4th Divis | Northern Power | Doyalson #3 | Division 4 | 22-Nov-2014 |
| 62* | Narara 5th Divis | Wyong | Mascord | Division 5 | 11-Jan-2014 |
| 56* | Narara 5th | Wyong | Kanwal Park | 5th Grade | 03-Jan-2009 |
| 63{ct} | Narara 4th | The Entrance | Alan Davidson | 4th Grade | 18-Nov-2006 |
| 51{ct} | Narara 5th | Wyong | Kanwal Park | 5th Grade | 26-Nov-2005 |
Results by Batting Position
| Position | Inn | NO | Runs | HS | Ave | SR | 100 | 50 |
|---|---|---|---|---|---|---|---|---|
| Open | 69 | 4 | 1350 | 107 | 20.77 | - | 1 | 5 |
| 3 | 16 | - | 212 | 40 | 13.25 | - | - | - |
| 4 | 13 | - | 196 | 61 | 15.08 | - | - | 1 |
| 5 | 9 | 3 | 130 | 36 | 21.67 | - | - | - |
| 6 | 23 | 5 | 401 | 44* | 22.28 | - | - | - |
| 7 | 27 | 3 | 404 | 52 | 16.83 | - | - | 3 |
| 8 | 33 | 7 | 548 | 62* | 21.08 | - | - | 1 |
| 9 | 31 | 9 | 388 | 39* | 17.64 | - | - | - |
| 10 | 27 | 8 | 230 | 52 | 12.11 | - | - | 1 |
| 11 | 29 | 15 | 177 | 56* | 12.64 | - | - | 1 |
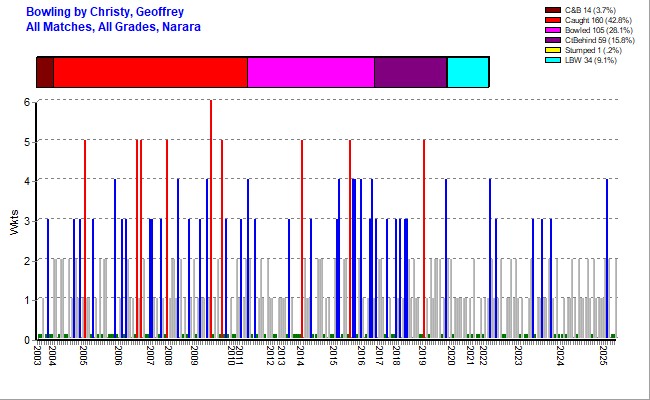
Bowling Statistics
| Overs | Maids | RunsA | Wkts | Best | Ave | 5WI | 10WM | Econ | SR |
|---|---|---|---|---|---|---|---|---|---|
| 2088.2 | 455 | 6252 | 373 | 6-33 Vs KCC 2008/09 | 16.76 | 9 | - | 2.99 | 33.59 |
Bowling Highlights
| O-M-R-W | Team | Vs | Ground | Grade | Date |
|---|---|---|---|---|---|
| 21-11-18-5 | Narara 6th | Lisarow | Lisarow Sporting Field | 6th Grade | 12-Jan-2019 |
| 12-3-29-5 | Narara 5th | The Entrance | Alan Davidson | 5th Grade | 10-Oct-2015 |
| 8.5-1-19-5 | Narara 5th Divis | The Entrance | Pat Morley | Division 5 | 04-Jan-2014 |
| 10-4-32-5 | Narara 3rd | Umina | McEvoy | 3rd Grade | 31-Oct-2009 |
| 16-4-33-6 | Narara 5th | Kincumber | EDSACC Sth | 5th Grade | 14-Mar-2009 |
| 18-2-51-5 | Narara 5th | Lisarow | Alan Davidson | 5th Grade | 08-Dec-2007 |
| 20-6-41-5 | Narara 4th | The Entrance | Alan Davidson | 4th Grade | 18-Nov-2006 |
| 10-2-34-5 | Narara 4th | Terrigal-Matcham | Alan Davidson | 4th Grade | 21-Oct-2006 |
| 13.3-1-31-5 | Narara 5th | Gosford | Adcock #3 | 5th Grade | 08-Jan-2005 |
First Match
| Batting | Bowling | Team | Vs | Ground | Date |
|---|---|---|---|---|---|
| dnb | 0-36 | Narara 5th | Terrigal-Matcham | Alan Davidson | 11-Oct-2003 |
Results by Opposition Team
| Opposition | Mat | Inn | NO | Runs | HS | Ave | SR | 100 | 50 | Overs | Maid | RunsA | Wkts | Ave | Best | 10W | 5WI | Cts | Sts | ROs |
|---|---|---|---|---|---|---|---|---|---|---|---|---|---|---|---|---|---|---|---|---|
| Brisbane Water | 16 | 14 | 5 | 156 | 30* | 17.33 | - | - | - | 116.4 | 18 | 378 | 29 | 13.03 | 4-23 | - | - | 4 | - | - |
| Doyalson | 8 | 9 | 4 | 152 | 48 | 30.40 | - | - | - | 71.4 | 15 | 224 | 9 | 24.89 | 3-30 | - | - | 11 | - | 2 |
| Gosford | 8 | 10 | 3 | 102 | 23 | 14.57 | - | - | - | 73.5 | 20 | 202 | 21 | 9.62 | 5-31 | - | 1 | 7 | - | - |
| Kincumber | 37 | 34 | 7 | 388 | 34* | 14.37 | - | - | - | 279.5 | 60 | 785 | 40 | 19.62 | 6-33 | - | 1 | 26 | - | 3 |
| Lisarow | 34 | 31 | 7 | 315 | 69 | 13.12 | - | - | 1 | 230.3 | 54 | 704 | 46 | 15.30 | 5-18 | - | 2 | 17 | - | 1 |
| Mountains | 9 | 6 | - | 94 | 46 | 15.67 | - | - | - | 64 | 10 | 161 | 12 | 13.42 | 4-17 | - | - | 4 | - | - |
| Northern Power | 21 | 19 | 2 | 370 | 107 | 21.76 | - | 1 | 2 | 107.5 | 21 | 348 | 19 | 18.32 | 3-8 | - | - | 9 | - | - |
| Southern Spirit | 15 | 15 | - | 220 | 51 | 14.67 | - | - | 1 | 68.1 | 15 | 263 | 15 | 17.53 | 4-35 | - | - | 9 | - | 2 |
| Terrigal-Matcham | 20 | 17 | 2 | 294 | 61 | 19.60 | - | - | 1 | 125.1 | 32 | 340 | 20 | 17.00 | 5-34 | - | 1 | 10 | - | - |
| The Entrance | 32 | 33 | 5 | 424 | 63 | 15.14 | - | - | 1 | 218.5 | 36 | 790 | 46 | 17.17 | 5-19 | - | 3 | 22 | - | 2 |
| Toukley | 9 | 8 | 1 | 74 | 32 | 10.57 | - | - | - | 101 | 19 | 357 | 8 | 44.62 | 3-43 | - | - | 8 | - | 1 |
| Toukley Gold | 2 | 2 | 1 | 26 | 18 | 26.00 | - | - | - | 4 | - | 16 | 1 | 16.00 | 1-16 | - | - | - | - | - |
| Umina | 10 | 12 | 5 | 182 | 36* | 26.00 | - | - | - | 80.5 | 26 | 189 | 15 | 12.60 | 5-32 | - | 1 | 8 | - | - |
| Warnervale | 22 | 19 | 4 | 336 | 92 | 22.40 | - | - | 2 | 155.3 | 36 | 482 | 27 | 17.85 | 4-8 | - | - | 10 | - | 1 |
| Woy Woy | 9 | 9 | 2 | 199 | 44* | 28.43 | - | - | - | 98.5 | 32 | 175 | 26 | 6.73 | 4-14 | - | - | 9 | - | 1 |
| Wyong | 38 | 39 | 6 | 704 | 62* | 21.33 | - | - | 4 | 291.4 | 61 | 838 | 39 | 21.49 | 3-12 | - | - | 33 | - | 4 |
Results by Ground
| Ground | Mat | Inn | NO | Runs | HS | Ave | SR | 100 | 50 | Overs | Maid | RunsA | Wkts | Ave | Best | 10W | 5WI | Cts | Sts | ROs |
|---|---|---|---|---|---|---|---|---|---|---|---|---|---|---|---|---|---|---|---|---|
| Adcock #3 | 9 | 10 | 4 | 107 | 30* | 17.83 | - | - | - | 74.5 | 10 | 244 | 23 | 10.61 | 5-31 | - | 1 | 5 | - | - |
| Adcock #7 | 2 | 3 | - | 50 | 23 | 16.67 | - | - | - | 25 | 11 | 78 | 4 | 19.50 | 2-19 | - | - | 3 | - | - |
| Adcock Park | 2 | 1 | - | - | - | - | - | - | - | 10.4 | 2 | 15 | 3 | 5.00 | 2-13 | - | - | - | - | - |
| Alan Davidson | 40 | 45 | 4 | 886 | 69 | 21.61 | - | - | 3 | 402 | 92 | 1126 | 81 | 13.90 | 5-29 | - | 4 | 23 | - | - |
| Austin Butler Oval | 1 | 1 | - | 5 | 5 | 5.00 | - | - | - | - | - | - | - | - | - | - | - | - | - | - |
| Baker Park | 1 | 1 | - | 12 | 12 | 12.00 | - | - | - | 2 | - | 13 | - | - | 0-13 | - | - | 1 | - | - |
| Bateau Bay North | 1 | 1 | - | 12 | 12 | 12.00 | - | - | - | 4 | 1 | 11 | - | - | 0-11 | - | - | - | - | - |
| Bateau Bay South | 1 | 2 | - | 29 | 26 | 14.50 | - | - | - | 10 | 4 | 23 | 2 | 11.50 | 2-23 | - | - | - | - | - |
| Bill Sohier Park (Sohie | 1 | 1 | - | - | - | - | - | - | - | 6 | 1 | 36 | 1 | 36.00 | 1-36 | - | - | - | - | - |
| Blue Haven | 3 | 3 | - | 96 | 56 | 32.00 | - | - | 1 | 15 | - | 57 | 4 | 14.25 | 2-19 | - | - | - | - | - |
| Carrington St | 53 | 48 | 11 | 651 | 52 | 17.59 | - | - | 1 | 343.2 | 64 | 1010 | 48 | 21.04 | 4-14 | - | - | 45 | - | 4 |
| Col Gooley Oval | 9 | 10 | 2 | 230 | 51 | 28.75 | - | - | 1 | 47.1 | 16 | 139 | 12 | 11.58 | 4-35 | - | - | 4 | - | 2 |
| Darren Kennedy | 6 | 5 | - | 42 | 18 | 8.40 | - | - | - | 16.5 | - | 65 | 2 | 32.50 | 1-15 | - | - | 1 | - | - |
| Don Small Oval | 1 | 2 | - | 23 | 21 | 11.50 | - | - | - | 17 | 1 | 66 | 1 | 66.00 | 1-30 | - | - | - | - | 1 |
| Doyalson #1 | 1 | 1 | 1 | 10 | 10* | - | - | - | - | 13 | 2 | 41 | - | - | 0-41 | - | - | 1 | - | - |
| Doyalson #3 | 1 | 1 | - | 50 | 50 | 50.00 | - | - | 1 | 6 | 1 | 21 | 1 | 21.00 | 1-21 | - | - | - | - | - |
| Doyalson #4 | 1 | 1 | 1 | 25 | 25* | - | - | - | - | 14 | 3 | 35 | 2 | 17.50 | 2-20 | - | - | 2 | - | - |
| EDSACC North | 2 | 2 | - | 12 | 12 | 6.00 | - | - | - | 7 | 2 | 8 | 1 | 8.00 | 1-8 | - | - | 3 | - | - |
| EDSACC Sth | 6 | 6 | 2 | 97 | 34* | 24.25 | - | - | - | 38 | 6 | 102 | 8 | 12.75 | 6-33 | - | 1 | 4 | - | - |
| Erina | 1 | 1 | - | 10 | 10 | 10.00 | - | - | - | - | - | - | - | - | - | - | - | 1 | - | - |
| Ettalong Oval | 1 | 1 | - | - | - | - | - | - | - | 4 | - | 23 | - | - | 0-23 | - | - | 1 | - | - |
| Fagans Park | 5 | 3 | 2 | 8 | 7* | 8.00 | - | - | - | 32 | 3 | 96 | 7 | 13.71 | 3-12 | - | - | 3 | - | 2 |
| Frost Reserve | 3 | 3 | 1 | 27 | 27* | 13.50 | - | - | - | 27 | 8 | 46 | 1 | 46.00 | 1-34 | - | - | 1 | - | 1 |
| Gavenlock Oval | 27 | 21 | 1 | 224 | 35 | 11.20 | - | - | - | 95.5 | 18 | 368 | 23 | 16.00 | 4-8 | - | - | 15 | - | - |
| Halekulani Oval | 6 | 5 | - | 37 | 32 | 7.40 | - | - | - | 59 | 15 | 162 | 6 | 27.00 | 3-18 | - | - | 4 | - | - |
| Hamlyn Terrace Oval [TB | 12 | 10 | 4 | 194 | 92 | 32.33 | - | - | 1 | 81.5 | 12 | 339 | 16 | 21.19 | 3-24 | - | - | 6 | - | 1 |
| Harry Moore | 4 | 4 | - | 58 | 45 | 14.50 | - | - | - | 31 | 4 | 140 | 3 | 46.67 | 3-43 | - | - | 2 | - | 1 |
| Hasslett Oval | 1 | - | - | - | - | - | - | - | - | 6 | 1 | 16 | - | - | 0-16 | - | - | - | - | - |
| Heazlett Park | 2 | 2 | - | 48 | 25 | 24.00 | - | - | - | 17 | 3 | 27 | 1 | 27.00 | 1-9 | - | - | - | - | - |
| Hylton Moore | 4 | 4 | - | 61 | 38 | 15.25 | - | - | - | 25.1 | 11 | 60 | 6 | 10.00 | 3-15 | - | - | 1 | - | - |
| Jubilee Park | 3 | 4 | 2 | 13 | 12 | 6.50 | - | - | - | 22 | 2 | 104 | 5 | 20.80 | 3-39 | - | - | 1 | - | - |
| Kanwal Park | 12 | 12 | 4 | 206 | 56* | 25.75 | - | - | 2 | 74.4 | 17 | 265 | 7 | 37.86 | 2-9 | - | - | 14 | - | - |
| Kariong | 2 | 1 | - | - | - | - | - | - | - | 14 | 1 | 41 | 3 | 13.67 | 3-19 | - | - | 3 | - | - |
| Kurraba | 3 | 3 | - | 12 | 12 | 4.00 | - | - | - | 42 | 10 | 96 | 5 | 19.20 | 3-49 | - | - | - | - | - |
| Lisarow Sporting Field | 3 | 3 | - | 40 | 22 | 13.33 | - | - | - | 30 | 13 | 45 | 11 | 4.09 | 5-18 | - | 1 | 1 | - | - |
| Mascord | 3 | 3 | 1 | 125 | 62* | 62.50 | - | - | 2 | 34 | 8 | 107 | 6 | 17.83 | 2-30 | - | - | 4 | - | - |
| McEvoy | 2 | 2 | 2 | 7 | 5* | - | - | - | - | 16 | 5 | 49 | 5 | 9.80 | 5-32 | - | 1 | 1 | - | - |
| McKillopOval | 6 | 4 | - | 38 | 30 | 9.50 | - | - | - | 41 | 9 | 122 | 7 | 17.43 | 2-21 | - | - | 4 | - | - |
| Morrie Breen | 1 | 1 | 1 | 39 | 39* | - | - | - | - | 6 | - | 17 | - | - | 0-17 | - | - | 1 | - | - |
| North Lakes | 1 | 2 | 2 | 28 | 28* | - | - | - | - | - | - | - | - | - | - | - | - | 2 | - | - |
| Ozanam Oval | 1 | 1 | 1 | 1 | 1* | - | - | - | - | - | - | - | - | - | - | - | - | - | - | - |
| Paddy Clifton No1 | 6 | 6 | 2 | 112 | 41* | 28.00 | - | - | - | 72.4 | 22 | 164 | 9 | 18.22 | 3-30 | - | - | 8 | - | 1 |
| Paddy Clifton No2 | 1 | 1 | - | 36 | 36 | 36.00 | - | - | - | 3 | - | 30 | 2 | 15.00 | 2-30 | - | - | - | - | 1 |
| Pat Morley | 2 | 3 | 1 | 12 | 9 | 6.00 | - | - | - | 25.5 | 4 | 68 | 7 | 9.71 | 5-19 | - | 1 | 2 | - | 1 |
| Paul Oval | 2 | 3 | - | 30 | 17 | 10.00 | - | - | - | 13 | 2 | 52 | 2 | 26.00 | 2-35 | - | - | 3 | - | - |
| Rogers Park | 6 | 5 | 1 | 5 | 4 | 1.25 | - | - | - | 37 | 8 | 102 | 7 | 14.57 | 4-30 | - | - | - | - | - |
| Rogers Park #2 | 6 | 6 | - | 50 | 31 | 8.33 | - | - | - | 50 | 19 | 99 | 16 | 6.19 | 4-17 | - | - | 6 | - | - |
| Saratoga Oval | 1 | 1 | 1 | 10 | 10* | - | - | - | - | 14.2 | 3 | 40 | 1 | 40.00 | 1-40 | - | - | 3 | - | 1 |
| Sohier Park | 7 | 5 | 3 | 44 | 15* | 22.00 | - | - | - | 54.1 | 12 | 186 | 8 | 23.25 | 3-23 | - | - | 2 | - | - |
| Tacoma | 3 | 4 | - | 21 | 13 | 5.25 | - | - | - | 29 | 8 | 56 | 3 | 18.67 | 2-17 | - | - | 2 | - | 1 |
| Taylor Park | 2 | 2 | - | 16 | 12 | 8.00 | - | - | - | 5 | - | 39 | - | - | 0-39 | - | - | - | - | - |
| Terrigal Haven | 1 | 2 | - | 19 | 11 | 9.50 | - | - | - | 23 | 9 | 57 | 4 | 14.25 | 3-22 | - | - | 1 | - | - |
| Tuggerah Sporting Compl | 1 | - | - | - | - | - | - | - | - | 2 | - | 12 | 1 | 12.00 | 1-12 | - | - | - | - | - |
| Tunkuwallin | 1 | 1 | - | 107 | 107 | 107.00 | - | 1 | - | - | - | - | - | - | - | - | - | - | - | - |
| Umina #2 | 1 | 1 | - | 9 | 9 | 9.00 | - | - | - | 6 | 1 | 9 | - | - | 0-9 | - | - | - | - | - |
| Wadalba Sports Complex | 1 | 1 | - | - | - | - | - | - | - | 8 | 2 | 27 | 1 | 27.00 | 1-27 | - | - | - | - | - |
| Woongarrah Oval | 4 | - | - | - | - | - | - | - | - | 12 | 3 | 37 | 2 | 18.50 | 1-12 | - | - | 1 | - | - |
| Woy Woy #1 | 1 | 2 | - | 52 | 41 | 26.00 | - | - | - | 23 | 6 | 61 | 5 | 12.20 | 3-47 | - | - | 2 | - | - |
Stats by Cricket Statz | Last updated 27-Apr-2025.