Shaun Clarke
All Matches, All Grades, Narara, 02-Nov-1935 to 15-Mar-2025
The Var is the variance of the scores to the mean. It is a measure of how reliable the batsman is at reaching their average. A low variance indicates the batsman will often get scores close to his average. A high variance indicates his scores are fairly unpredictable.
| Mat | Cts | ROs | Sts | GFs | GFWon |
|---|---|---|---|---|---|
| 134 | 49 | 2 | - | 1 | - |
Results by Season
| Season | Mat | Inn | NO | Runs | HS | Ave | SR | 100 | 50 | Overs | Maid | RunsA | Wkts | Ave | Best | 10W | 5WI | Cts | Sts | ROs |
|---|---|---|---|---|---|---|---|---|---|---|---|---|---|---|---|---|---|---|---|---|
| 1993/94 | 1 | 1 | - | 20 | 20 | 20.00 | - | - | - | - | - | - | - | - | - | - | - | - | - | - |
| 1995/96 | 12 | 16 | - | 317 | 57 | 19.81 | - | - | 2 | 20 | 3 | 72 | 3 | 24.00 | 2-44 | - | - | - | - | - |
| 1996/97 | 11 | 13 | - | 329 | 110 | 25.31 | - | 1 | 1 | 80.1 | 9 | 298 | 18 | 16.56 | 5-36 | - | 1 | 7 | - | - |
| 1997/98 | 12 | 14 | - | 218 | 47 | 15.57 | - | - | - | 59.5 | 15 | 204 | 7 | 29.14 | 2-13 | - | - | 7 | - | - |
| 1998/99 | 8 | 8 | - | 178 | 81 | 22.25 | - | - | 2 | 2 | - | 12 | - | - | 0-12 | - | - | 4 | - | 1 |
| 1999/00 | 11 | 15 | 2 | 423 | 127 | 32.54 | - | 1 | 1 | 12 | 1 | 59 | 3 | 19.67 | 2-23 | - | - | 4 | - | - |
| 2000/01 | 9 | 10 | - | 164 | 45 | 16.40 | - | - | - | 2 | - | 20 | - | - | 0-20 | - | - | 4 | - | - |
| 2001/02 | 4 | 5 | - | 31 | 13 | 6.20 | - | - | - | 14 | 4 | 42 | 1 | 42.00 | 1-9 | - | - | 4 | - | - |
| 2002/03 | 13 | 14 | 1 | 370 | 106* | 28.46 | - | 1 | 2 | 5.4 | 1 | 23 | 1 | 23.00 | 1-9 | - | - | 3 | - | - |
| 2003/04 | 11 | 12 | 1 | 263 | 53 | 23.91 | - | - | 1 | 31 | 6 | 90 | 4 | 22.50 | 3-21 | - | - | 9 | - | - |
| 2004/05 | 13 | 15 | 3 | 694 | 100* | 57.83 | - | 1 | 6 | 122.1 | 11 | 489 | 20 | 24.45 | 4-59 | - | - | 1 | - | - |
| 2005/06 | 12 | 11 | - | 125 | 35 | 11.36 | - | - | - | 12 | 4 | 27 | 3 | 9.00 | 2-18 | - | - | 2 | - | - |
| 2006/07 | 12 | 11 | - | 231 | 41 | 21.00 | - | - | - | 94 | 14 | 322 | 18 | 17.89 | 5-41 | - | 1 | 3 | - | 1 |
| 2007/08 | 5 | 5 | - | 42 | 17 | 8.40 | - | - | - | 40.2 | - | 148 | 12 | 12.33 | 6-43 | - | 1 | 1 | - | - |
Results by Grade
| Grade | Mat | Inn | NO | Runs | HS | Ave | SR | 100 | 50 | Overs | Maid | RunsA | Wkts | Ave | Best | 10W | 5WI | Cts | Sts | ROs |
|---|---|---|---|---|---|---|---|---|---|---|---|---|---|---|---|---|---|---|---|---|
| 2nd Grade | 17 | 16 | - | 151 | 35 | 9.44 | - | - | - | 21.2 | 4 | 68 | 6 | 11.33 | 3-41 | - | - | 2 | - | - |
| 3rd Grade | 42 | 44 | 4 | 1276 | 100* | 31.90 | - | 1 | 7 | 280.1 | 31 | 1028 | 51 | 20.16 | 6-43 | - | 2 | 15 | - | 1 |
| 4th Grade | 48 | 59 | 3 | 1329 | 127 | 23.73 | - | 2 | 5 | 107.3 | 23 | 401 | 18 | 22.28 | 4-71 | - | - | 24 | - | - |
| 5th Grade | 8 | 8 | - | 188 | 110 | 23.50 | - | 1 | - | 57.1 | 6 | 214 | 12 | 17.83 | 5-36 | - | 1 | 4 | - | 1 |
| 6th Grade | 19 | 23 | - | 461 | 65 | 20.04 | - | - | 3 | 29 | 4 | 95 | 3 | 31.67 | 2-44 | - | - | 4 | - | - |
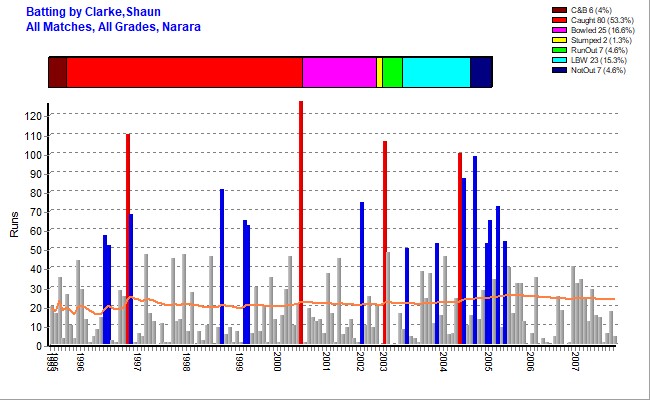
Batting Statistics
| Inns | NOs | Runs | HS | Ave | Var% | 50s | 100s | 4s | 6s | Ret |
|---|---|---|---|---|---|---|---|---|---|---|
| 150 | 7 | 3405 | 127 Vs TMCC 1999/00 | 23.81 | 100.09% | 15 | 4 | 204 | 14 | - |
Batting Highlights
| Score/s | Team | Vs | Ground | Grade | Date |
|---|---|---|---|---|---|
| 54* | Narara 3rd | Kincumber | Carrington St | 3rd Grade | 19-Feb-2005 |
| 72{ct} | Narara 3rd | Lisarow | Sohier Park | 3rd Grade | 05-Feb-2005 |
| 65{lb} | Narara 3rd | Gosford | Adcock #7 | 3rd Grade | 08-Jan-2005 |
| 53{ct} | Narara 3rd | Doyalson | Carrington St | 3rd Grade | 11-Dec-2004 |
| 98{ct} | Narara 3rd | Woy Woy | Woy Woy #2 | 3rd Grade | 13-Nov-2004 |
| 87{ct} | Narara 3rd | Wyong | Carrington St | 3rd Grade | 16-Oct-2004 |
| 100* | Narara 3rd | Umina | McEvoy | 3rd Grade | 02-Oct-2004 |
| 53{lb} | Narara 3rd | The Entrance | Bateau Bay North | 3rd Grade | 13-Dec-2003 |
| 50{ct} | Narara 4th | Lisarow | EDSACC Sth | 4th Grade | 15-Mar-2003 |
| 106* | Narara 4th | Lisarow | Carrington St | 4th Grade | 04-Jan-2003 |
| 74{ct} | Narara 4th | Wyong | Carrington St | 4th Grade | 05-Oct-2002 |
| 127{b} | Narara 4th | Terrigal-Matcham | Paul Oval | 4th Grade | 26-Feb-2000 |
| 62{ct} | Narara 4th | The Entrance | Alan Davidson | 4th Grade | 02-Oct-1999 |
| 65{ct} | Narara 6th White | Toukley | Paddy Clifton No1 | 6th Grade | 27-Feb-1999 |
| 81{lb} | Narara 4th | Woy Woy | Alan Davidson | 4th Grade | 17-Oct-1998 |
| 68{st} | Narara 4th | Lisarow | Sohier Park | 4th Grade | 07-Dec-1996 |
| 110{ct} | Narara 5th Gold | Woy Woy | Adcock #3 | 5th Grade | 23-Nov-1996 |
| 52{b} | Narara 6th White | Kincumber | Adcock #3 | 6th Grade | 02-Mar-1996 |
| 57{ct} | Narara 6th White | Umina | Umina #2 | 6th Grade | 24-Feb-1996 |
Results by Batting Position
| Position | Inn | NO | Runs | HS | Ave | SR | 100 | 50 |
|---|---|---|---|---|---|---|---|---|
| Open | 82 | - | 1661 | 127 | 20.26 | - | 2 | 6 |
| 3 | 50 | 3 | 1269 | 106* | 27.00 | - | 1 | 8 |
| 4 | 11 | 2 | 378 | 100* | 42.00 | - | 1 | 1 |
| 5 | 3 | - | 34 | 34 | 11.33 | - | - | - |
| 6 | 2 | 2 | 39 | 29* | - | - | - | - |
| 7 | 2 | - | 24 | 18 | 12.00 | - | - | - |
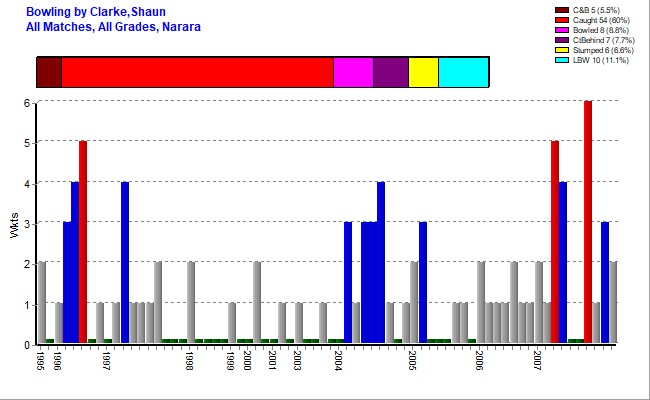
Bowling Statistics
| Overs | Maids | RunsA | Wkts | Best | Ave | 5WI | 10WM | Econ | SR |
|---|---|---|---|---|---|---|---|---|---|
| 495.1 | 68 | 1806 | 90 | 6-43 Vs GCC 2007/08 | 20.07 | 3 | - | 3.65 | 33.01 |
Bowling Highlights
| O-M-R-W | Team | Vs | Ground | Grade | Date |
|---|---|---|---|---|---|
| 13-0-43-6 | Narara 3rd | Gosford | Adcock #3 | 3rd Grade | 06-Oct-2007 |
| 11.3-1-41-5 | Narara 3rd | Lisarow | Sohier Park | 3rd Grade | 17-Feb-2007 |
| 14-2-36-5 | Narara 5th Gold | Gosford | Adcock #3 | 5th Grade | 09-Nov-1996 |
First Match
| Batting | Bowling | Team | Vs | Ground | Date |
|---|---|---|---|---|---|
| 20{ct} | Narara 6th White | Woy Woy | Ettalong Oval | 09-Oct-1993 |
Results by Opposition Team
| Opposition | Mat | Inn | NO | Runs | HS | Ave | SR | 100 | 50 | Overs | Maid | RunsA | Wkts | Ave | Best | 10W | 5WI | Cts | Sts | ROs |
|---|---|---|---|---|---|---|---|---|---|---|---|---|---|---|---|---|---|---|---|---|
| Doyalson | 8 | 9 | 1 | 200 | 53 | 25.00 | - | - | 1 | 33.4 | 8 | 121 | 7 | 17.29 | 2-23 | - | - | 5 | - | - |
| Gosford | 14 | 14 | - | 307 | 65 | 21.93 | - | - | 1 | 80.1 | 6 | 262 | 19 | 13.79 | 6-43 | - | 2 | 7 | - | - |
| Kincumber | 15 | 18 | 1 | 388 | 54* | 22.82 | - | - | 2 | 40 | 2 | 179 | 5 | 35.80 | 4-91 | - | - | 3 | - | - |
| Lisarow | 13 | 14 | 2 | 451 | 106* | 37.58 | - | 1 | 3 | 44.3 | 4 | 165 | 9 | 18.33 | 5-41 | - | 1 | 9 | - | 1 |
| Mountains | 10 | 12 | - | 134 | 47 | 11.17 | - | - | - | 39 | 8 | 134 | 5 | 26.80 | 2-18 | - | - | 6 | - | - |
| Narara 6th Green | 1 | 1 | - | 26 | 26 | 26.00 | - | - | - | 6 | 1 | 24 | - | - | 0-24 | - | - | - | - | - |
| Terrigal-Matcham | 10 | 11 | - | 243 | 127 | 22.09 | - | 1 | - | - | - | - | - | - | - | - | - | 3 | - | - |
| The Entrance | 14 | 18 | - | 340 | 62 | 18.89 | - | - | 2 | 44.5 | 3 | 210 | 6 | 35.00 | 3-90 | - | - | 4 | - | 1 |
| Toukley | 14 | 15 | 1 | 250 | 65 | 17.86 | - | - | 1 | 37 | 5 | 120 | 7 | 17.14 | 3-21 | - | - | 1 | - | - |
| Umina | 13 | 15 | 2 | 340 | 100* | 26.15 | - | 1 | 1 | 56.1 | 14 | 190 | 10 | 19.00 | 4-56 | - | - | 3 | - | - |
| Woy Woy | 13 | 14 | - | 475 | 110 | 33.93 | - | 1 | 2 | 73.5 | 11 | 279 | 13 | 21.46 | 4-59 | - | - | 5 | - | - |
| Wyong | 9 | 9 | - | 251 | 87 | 27.89 | - | - | 2 | 40 | 6 | 122 | 9 | 13.56 | 3-21 | - | - | 3 | - | - |
Results by Ground
| Ground | Mat | Inn | NO | Runs | HS | Ave | SR | 100 | 50 | Overs | Maid | RunsA | Wkts | Ave | Best | 10W | 5WI | Cts | Sts | ROs |
|---|---|---|---|---|---|---|---|---|---|---|---|---|---|---|---|---|---|---|---|---|
| Adcock #3 | 8 | 9 | - | 260 | 110 | 28.89 | - | 1 | 1 | 51.1 | 5 | 175 | 16 | 10.94 | 6-43 | - | 2 | 3 | - | - |
| Adcock #7 | 2 | 2 | - | 75 | 65 | 37.50 | - | - | 1 | 10.1 | - | 29 | 2 | 14.50 | 2-29 | - | - | - | - | - |
| Adcock Park | 1 | 1 | - | - | - | - | - | - | - | - | - | - | - | - | - | - | - | - | - | - |
| Alan Davidson | 21 | 22 | 1 | 533 | 81 | 25.38 | - | - | 2 | 78.3 | 16 | 315 | 15 | 21.00 | 4-56 | - | - | 10 | - | - |
| Avoca Oval | 2 | 2 | - | 21 | 19 | 10.50 | - | - | - | 2 | - | 20 | - | - | 0-20 | - | - | 2 | - | - |
| Bateau Bay North | 6 | 9 | - | 162 | 53 | 18.00 | - | - | 1 | 13.5 | 1 | 56 | 1 | 56.00 | 1-13 | - | - | 4 | - | - |
| Bateau Bay South | 1 | 1 | - | 1 | 1 | 1.00 | - | - | - | 7 | - | 29 | 1 | 29.00 | 1-29 | - | - | - | - | - |
| Blue Haven | 2 | 2 | - | 49 | 48 | 24.50 | - | - | - | 4.4 | 1 | 22 | 1 | 22.00 | 1-9 | - | - | 2 | - | - |
| Carrington St | 25 | 30 | 3 | 799 | 106* | 29.59 | - | 1 | 4 | 79 | 5 | 305 | 11 | 27.73 | 3-41 | - | - | 8 | - | - |
| Doyalson #2 | 1 | 1 | - | 1 | 1 | 1.00 | - | - | - | - | - | - | - | - | - | - | - | 1 | - | - |
| Eastern Road | 1 | 1 | - | 29 | 29 | 29.00 | - | - | - | - | - | - | - | - | - | - | - | - | - | - |
| EDSACC Sth | 2 | 2 | - | 59 | 50 | 29.50 | - | - | 1 | - | - | - | - | - | - | - | - | - | - | - |
| Erina | 1 | 1 | - | 35 | 35 | 35.00 | - | - | - | - | - | - | - | - | - | - | - | - | - | - |
| Ettalong Oval | 1 | 1 | - | 20 | 20 | 20.00 | - | - | - | - | - | - | - | - | - | - | - | - | - | - |
| Fagans Park | 1 | 1 | - | 11 | 11 | 11.00 | - | - | - | 21 | 2 | 71 | 4 | 17.75 | 4-71 | - | - | - | - | - |
| Gavenlock Oval | 8 | 7 | - | 75 | 32 | 10.71 | - | - | - | 8 | 2 | 18 | 2 | 9.00 | 2-18 | - | - | 2 | - | - |
| Halekulani Oval | 6 | 6 | 1 | 92 | 37 | 18.40 | - | - | - | 22 | 2 | 75 | 4 | 18.75 | 3-21 | - | - | 1 | - | - |
| Harry Moore | 2 | 3 | - | 46 | 27 | 15.33 | - | - | - | - | - | - | - | - | - | - | - | - | - | - |
| Hasslett Oval | 1 | 1 | - | 28 | 28 | 28.00 | - | - | - | 19 | 1 | 91 | 4 | 22.75 | 4-91 | - | - | - | - | - |
| Hylton Moore | 1 | 2 | - | 38 | 35 | 19.00 | - | - | - | - | - | - | - | - | - | - | - | - | - | - |
| James Brown | 7 | 8 | - | 123 | 44 | 15.38 | - | - | - | 19 | 3 | 68 | 2 | 34.00 | 2-44 | - | - | - | - | - |
| Kanwal Park | 2 | 3 | - | 13 | 8 | 4.33 | - | - | - | 1 | - | 4 | 1 | 4.00 | 1-4 | - | - | 1 | - | - |
| Kariong | 6 | 7 | - | 67 | 20 | 9.57 | - | - | - | 39 | 8 | 134 | 5 | 26.80 | 2-18 | - | - | 3 | - | - |
| McEvoy | 5 | 6 | 1 | 192 | 100* | 38.40 | - | 1 | - | 29 | 9 | 93 | 2 | 46.50 | 1-16 | - | - | 1 | - | - |
| Paddy Clifton No1 | 2 | 2 | - | 72 | 65 | 36.00 | - | - | 1 | - | - | - | - | - | - | - | - | 1 | - | 1 |
| Paul Oval | 3 | 3 | - | 153 | 127 | 51.00 | - | 1 | - | - | - | - | - | - | - | - | - | 1 | - | - |
| Rogers Park | 3 | 3 | - | 39 | 29 | 13.00 | - | - | - | 15.2 | - | 67 | 3 | 22.33 | 3-41 | - | - | - | - | 1 |
| Sohier Park | 6 | 7 | 1 | 220 | 72 | 36.67 | - | - | 2 | 27.3 | 3 | 109 | 7 | 15.57 | 5-41 | - | 1 | 5 | - | - |
| Tacoma | 2 | 1 | - | 25 | 25 | 25.00 | - | - | - | 21 | 5 | 32 | 4 | 8.00 | 3-21 | - | - | 1 | - | - |
| Umina #1 | 1 | 1 | - | 1 | 1 | 1.00 | - | - | - | 4 | 2 | 9 | 1 | 9.00 | 1-9 | - | - | - | - | - |
| Umina #2 | 1 | 1 | - | 57 | 57 | 57.00 | - | - | 1 | - | - | - | - | - | - | - | - | - | - | - |
| Woy Woy #2 | 3 | 4 | - | 109 | 98 | 27.25 | - | - | 1 | 23 | 3 | 84 | 4 | 21.00 | 4-59 | - | - | 3 | - | - |
Stats by Cricket Statz | Last updated 27-Apr-2025.