Thomas Maurer
All Matches, All Grades, Narara, 02-Nov-1935 to 15-Mar-2025
The Var is the variance of the scores to the mean. It is a measure of how reliable the batsman is at reaching their average. A low variance indicates the batsman will often get scores close to his average. A high variance indicates his scores are fairly unpredictable.
| Mat | Cts | ROs | Sts | GFs | GFWon |
|---|---|---|---|---|---|
| 174 | 66 | 3 | - | 1 | 1 |
Results by Season
| Season | Mat | Inn | NO | Runs | HS | Ave | SR | 100 | 50 | Overs | Maid | RunsA | Wkts | Ave | Best | 10W | 5WI | Cts | Sts | ROs |
|---|---|---|---|---|---|---|---|---|---|---|---|---|---|---|---|---|---|---|---|---|
| 2001/02 | 10 | 12 | 1 | 548 | 132 | 49.82 | - | 2 | 2 | 6 | - | 28 | 1 | 28.00 | 1-12 | - | - | 11 | - | - |
| 2002/03 | 12 | 13 | - | 336 | 78 | 25.85 | - | - | 2 | 64.3 | 8 | 199 | 15 | 13.27 | 3-4 | - | - | 6 | - | - |
| 2003/04 | 12 | 12 | - | 132 | 35 | 11.00 | - | - | - | 72 | 16 | 190 | 15 | 12.67 | 4-40 | - | - | 2 | - | 1 |
| 2004/05 | 11 | 12 | - | 186 | 41 | 15.50 | - | - | - | 27.3 | 6 | 109 | 3 | 36.33 | 2-3 | - | - | 1 | - | - |
| 2005/06 | 11 | 14 | 1 | 120 | 22 | 9.23 | - | - | - | 2 | - | 21 | - | - | 0-21 | - | - | 9 | - | - |
| 2006/07 | 10 | 11 | 2 | 271 | 66 | 30.11 | - | - | 1 | - | - | - | - | - | - | - | - | 4 | - | - |
| 2007/08 | 10 | 13 | 1 | 269 | 88 | 22.42 | - | - | 1 | 47.1 | 10 | 140 | 7 | 20.00 | 2-14 | - | - | 2 | - | - |
| 2008/09 | 22 | 20 | 5 | 279 | 48 | 18.60 | - | - | - | 6 | - | 37 | 2 | 18.50 | 2-7 | - | - | 5 | - | 1 |
| 2009/10 | 14 | 14 | 1 | 113 | 30 | 8.69 | - | - | - | 10 | 1 | 62 | 1 | 62.00 | 1-13 | - | - | 6 | - | - |
| 2010/11 | 11 | 10 | - | 221 | 48 | 22.10 | - | - | - | 5 | - | 18 | - | - | 0-7 | - | - | 6 | - | 1 |
| 2011/12 | 10 | 10 | 1 | 154 | 49 | 17.11 | - | - | - | 11 | - | 64 | 1 | 64.00 | 1-38 | - | - | 5 | - | - |
| 2012/13 | 11 | 7 | 1 | 70 | 30 | 11.67 | - | - | - | 3 | - | 29 | 1 | 29.00 | 1-29 | - | - | 4 | - | - |
| 2013/14 | 13 | 10 | 2 | 148 | 42 | 18.50 | - | - | - | 3 | - | 14 | 2 | 7.00 | 2-14 | - | - | 4 | - | - |
| 2014/15 | 6 | 4 | 1 | 42 | 35* | 14.00 | - | - | - | - | - | - | - | - | - | - | - | - | - | - |
| 2015/16 | 11 | 10 | 1 | 182 | 61 | 20.22 | - | - | 1 | 7 | 1 | 10 | - | - | 0-1 | - | - | 1 | - | - |
Results by Grade
| Grade | Mat | Inn | NO | Runs | HS | Ave | SR | 100 | 50 | Overs | Maid | RunsA | Wkts | Ave | Best | 10W | 5WI | Cts | Sts | ROs |
|---|---|---|---|---|---|---|---|---|---|---|---|---|---|---|---|---|---|---|---|---|
| 4th Grade | 29 | 32 | - | 459 | 48 | 14.34 | - | - | - | 32.3 | 6 | 127 | 3 | 42.33 | 2-3 | - | - | 12 | - | 1 |
| 5th Grade | 57 | 64 | 5 | 1303 | 113* | 22.08 | - | 1 | 4 | 185.4 | 34 | 550 | 37 | 14.86 | 4-40 | - | - | 25 | - | 1 |
| 6th Grade | 5 | 7 | - | 368 | 132 | 52.57 | - | 1 | 2 | 6 | - | 28 | 1 | 28.00 | 1-12 | - | - | 6 | - | - |
| 7th Grade | 43 | 38 | 7 | 527 | 61 | 17.00 | - | - | 1 | 23 | 2 | 109 | 3 | 36.33 | 2-7 | - | - | 10 | - | 1 |
| Division 3 | 1 | 1 | - | - | - | - | - | - | - | - | - | - | - | - | - | - | - | - | - | - |
| Division 4 | 3 | 2 | - | - | - | - | - | - | - | - | - | - | - | - | - | - | - | - | - | - |
| Division 5 | 13 | 8 | 2 | 112 | 35* | 18.67 | - | - | - | 3 | - | 29 | 1 | 29.00 | 1-29 | - | - | 4 | - | - |
| Division 6 | 13 | 10 | 2 | 148 | 42 | 18.50 | - | - | - | 3 | - | 14 | 2 | 7.00 | 2-14 | - | - | 4 | - | - |
| ODLO 2nd Grade | 10 | 10 | 1 | 154 | 49 | 17.11 | - | - | - | 11 | - | 64 | 1 | 64.00 | 1-38 | - | - | 5 | - | - |
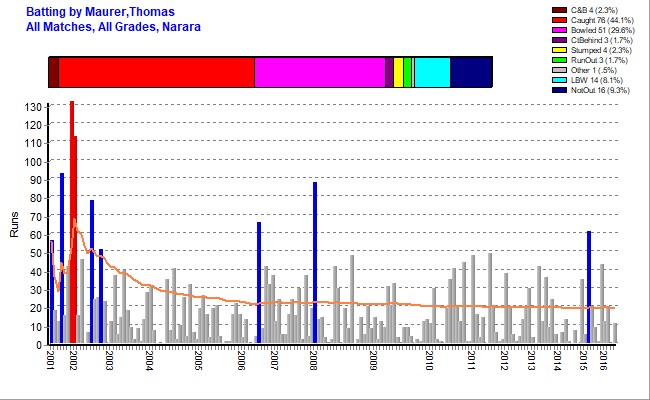
Batting Statistics
| Inns | NOs | Runs | HS | Ave | Var% | 50s | 100s | 4s | 6s | Ret |
|---|---|---|---|---|---|---|---|---|---|---|
| 172 | 17 | 3071 | 132 Vs TMCC 2001/02 | 19.81 | 102.98% | 7 | 2 | 355 | 42 | 1 |
Batting Highlights
| Score/s | Team | Vs | Ground | Grade | Date |
|---|---|---|---|---|---|
| 61{b} | Narara 7th | Kincumber | Hasslett Oval | 7th Grade | 10-Oct-2015 |
| 88{ct} | Narara 5th | Kincumber | Saratoga Oval | 5th Grade | 05-Jan-2008 |
| 66{b} | Narara 5th | Wyong | Blue Haven | 5th Grade | 07-Oct-2006 |
| 51{ct} | Narara 5th | Woy Woy | Alan Davidson | 5th Grade | 30-Nov-2002 |
| 78{b} | Narara 5th | Gosford | Adcock #7 | 5th Grade | 19-Oct-2002 |
| 113* | Narara 5th | Woy Woy | Paddy Clifton No1 | 5th Grade | 05-Jan-2002 |
| 132{b} | Narara 6th Green | Terrigal-Matcham | Ettalong Oval | 6th Grade | 15-Dec-2001 |
| 93{b} | Narara 6th White | Gosford | Alan Davidson | 6th Grade | 20-Oct-2001 |
| 56{b} | Narara 6th Green | Umina | Alan Davidson | 6th Grade | 06-Oct-2001 |
Results by Batting Position
| Position | Inn | NO | Runs | HS | Ave | SR | 100 | 50 |
|---|---|---|---|---|---|---|---|---|
| Open | 6 | - | 49 | 43 | 8.17 | - | - | - |
| 3 | 21 | - | 548 | 132 | 26.10 | - | 1 | 2 |
| 4 | 17 | 2 | 492 | 113* | 32.80 | - | 1 | 3 |
| 5 | 41 | - | 936 | 88 | 22.83 | - | - | 2 |
| 6 | 36 | 5 | 517 | 41 | 16.68 | - | - | - |
| 7 | 23 | 1 | 186 | 30 | 8.45 | - | - | - |
| 8 | 16 | 4 | 240 | 42 | 20.00 | - | - | - |
| 9 | 7 | 2 | 62 | 24* | 12.40 | - | - | - |
| 10 | 1 | 1 | 5 | 5* | - | - | - | - |
| 11 | 4 | 2 | 36 | 19* | 18.00 | - | - | - |
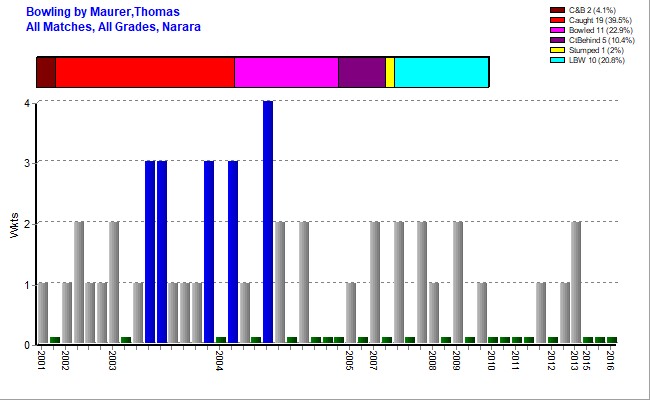
Bowling Statistics
| Overs | Maids | RunsA | Wkts | Best | Ave | 5WI | 10WM | Econ | SR |
|---|---|---|---|---|---|---|---|---|---|
| 264.1 | 42 | 921 | 48 | 4-40 Vs KCC 2003/04 | 19.19 | - | - | 3.49 | 33.02 |
First Match
| Batting | Bowling | Team | Vs | Ground | Date |
|---|---|---|---|---|---|
| 56{b},18{ct} | 1-12, 0-16 | Narara 6th Green | Umina | Alan Davidson | 06-Oct-2001 |
Results by Opposition Team
| Opposition | Mat | Inn | NO | Runs | HS | Ave | SR | 100 | 50 | Overs | Maid | RunsA | Wkts | Ave | Best | 10W | 5WI | Cts | Sts | ROs |
|---|---|---|---|---|---|---|---|---|---|---|---|---|---|---|---|---|---|---|---|---|
| Brisbane Water | 4 | 3 | - | 29 | 11 | 9.67 | - | - | - | - | - | - | - | - | - | - | - | - | - | - |
| Doyalson | 14 | 15 | 2 | 230 | 44 | 17.69 | - | - | - | 8.3 | - | 57 | 3 | 19.00 | 3-4 | - | - | 6 | - | - |
| Gosford | 11 | 13 | 1 | 311 | 93 | 25.92 | - | - | 2 | 10 | 1 | 42 | 1 | 42.00 | 1-9 | - | - | 8 | - | - |
| Kincumber | 17 | 17 | 2 | 334 | 88 | 22.27 | - | - | 2 | 18 | 3 | 82 | 4 | 20.50 | 4-40 | - | - | 4 | - | 2 |
| Lisarow | 24 | 23 | 3 | 264 | 35* | 13.20 | - | - | - | 40.4 | 10 | 97 | 9 | 10.78 | 2-17 | - | - | 13 | - | - |
| Mountains | 10 | 8 | - | 118 | 42 | 14.75 | - | - | - | 21 | 4 | 66 | 6 | 11.00 | 3-21 | - | - | 5 | - | - |
| Northern Power | 3 | 3 | - | 67 | 42 | 22.33 | - | - | - | 5 | 1 | 5 | - | - | 0-5 | - | - | 1 | - | - |
| Terrigal-Matcham | 17 | 16 | 1 | 256 | 132 | 17.07 | - | 1 | - | 38 | 2 | 153 | 5 | 30.60 | 3-56 | - | - | 3 | - | - |
| The Entrance | 12 | 14 | - | 212 | 49 | 15.14 | - | - | - | 23 | 3 | 76 | 5 | 15.20 | 3-43 | - | - | 4 | - | - |
| Toukley | 11 | 12 | 2 | 176 | 46 | 17.60 | - | - | - | 29 | 3 | 142 | 3 | 47.33 | 2-7 | - | - | 4 | - | 1 |
| Umina | 15 | 13 | 2 | 279 | 56 | 25.36 | - | - | 1 | 38 | 12 | 93 | 5 | 18.60 | 1-5 | - | - | 8 | - | - |
| Warnervale | 7 | 6 | 1 | 136 | 43 | 27.20 | - | - | - | 4 | - | 16 | - | - | 0-1 | - | - | - | - | - |
| Woy Woy | 13 | 15 | 2 | 382 | 113* | 29.38 | - | 1 | 1 | 20 | 1 | 55 | 5 | 11.00 | 2-14 | - | - | 4 | - | - |
| Wyong | 16 | 14 | 1 | 277 | 66 | 21.31 | - | - | 1 | 9 | 2 | 37 | 2 | 18.50 | 2-3 | - | - | 6 | - | - |
Results by Ground
| Ground | Mat | Inn | NO | Runs | HS | Ave | SR | 100 | 50 | Overs | Maid | RunsA | Wkts | Ave | Best | 10W | 5WI | Cts | Sts | ROs |
|---|---|---|---|---|---|---|---|---|---|---|---|---|---|---|---|---|---|---|---|---|
| Adcock #3 | 1 | 1 | - | - | - | - | - | - | - | - | - | - | - | - | - | - | - | 1 | - | - |
| Adcock #7 | 5 | 6 | 1 | 166 | 78 | 33.20 | - | - | 1 | 4 | - | 30 | 1 | 30.00 | 1-9 | - | - | 3 | - | - |
| Alan Davidson | 45 | 45 | 4 | 852 | 93 | 20.78 | - | - | 3 | 88.1 | 16 | 238 | 16 | 14.88 | 2-14 | - | - | 21 | - | - |
| Bateau Bay North | 2 | 2 | - | 33 | 26 | 16.50 | - | - | - | 10 | 3 | 18 | 2 | 9.00 | 2-18 | - | - | - | - | - |
| Bateau Bay South | 2 | 3 | - | 31 | 28 | 10.33 | - | - | - | 14 | 2 | 43 | 3 | 14.33 | 3-43 | - | - | - | - | - |
| Bloodtree Road | 2 | 2 | - | 24 | 24 | 12.00 | - | - | - | 7 | 1 | 21 | 3 | 7.00 | 3-21 | - | - | 1 | - | - |
| Blue Haven | 3 | 3 | - | 91 | 66 | 30.33 | - | - | 1 | 1 | - | 4 | - | - | 0-4 | - | - | 1 | - | - |
| Carrington St | 18 | 16 | - | 301 | 44 | 18.81 | - | - | - | 39.3 | 5 | 144 | 4 | 36.00 | 3-56 | - | - | 6 | - | 1 |
| Col Gooley Oval | 1 | 1 | - | 48 | 48 | 48.00 | - | - | - | - | - | - | - | - | - | - | - | 2 | - | - |
| Darren Kennedy | 2 | 3 | - | 35 | 30 | 11.67 | - | - | - | 14 | 3 | 61 | 2 | 30.50 | 2-7 | - | - | 1 | - | - |
| Doyalson #3 | 3 | 3 | - | 26 | 19 | 8.67 | - | - | - | 3 | - | 26 | - | - | 0-26 | - | - | 2 | - | - |
| Eastern Road | 1 | 1 | - | 49 | 49 | 49.00 | - | - | - | - | - | - | - | - | - | - | - | - | - | - |
| EDSACC North | 1 | 1 | - | 7 | 7 | 7.00 | - | - | - | - | - | - | - | - | - | - | - | - | - | - |
| EDSACC Sth | 1 | 1 | - | 37 | 37 | 37.00 | - | - | - | 9 | 1 | 33 | 2 | 16.50 | 2-33 | - | - | - | - | - |
| Ettalong Oval | 1 | 1 | - | 132 | 132 | 132.00 | - | 1 | - | - | - | - | - | - | - | - | - | 1 | - | - |
| Frost Reserve | 1 | 1 | - | 3 | 3 | 3.00 | - | - | - | - | - | - | - | - | - | - | - | - | - | - |
| Harry Moore | 2 | 2 | - | 21 | 20 | 10.50 | - | - | - | 5 | 1 | 5 | - | - | 0-5 | - | - | 1 | - | 1 |
| Hasslett Oval | 3 | 4 | - | 112 | 61 | 28.00 | - | - | 1 | - | - | - | - | - | - | - | - | 1 | - | - |
| Hylton Moore | 4 | 3 | - | 12 | 9 | 4.00 | - | - | - | 1 | - | 3 | - | - | 0-3 | - | - | 1 | - | - |
| Kanwal Park | 4 | 1 | - | 22 | 22 | 22.00 | - | - | - | 3 | - | 16 | - | - | 0-16 | - | - | 2 | - | - |
| Kariong | 1 | 1 | - | 1 | 1 | 1.00 | - | - | - | - | - | - | - | - | - | - | - | - | - | - |
| Kurraba | 3 | 3 | - | 21 | 16 | 7.00 | - | - | - | - | - | - | - | - | - | - | - | 1 | - | - |
| Mascord | 2 | 1 | 1 | 33 | 33* | - | - | - | - | - | - | - | - | - | - | - | - | - | - | - |
| McEvoy | 5 | 5 | 1 | 76 | 36* | 19.00 | - | - | - | 11.3 | 4 | 16 | 5 | 3.20 | 3-4 | - | - | 1 | - | - |
| McKillopOval | 1 | 1 | - | - | - | - | - | - | - | - | - | - | - | - | - | - | - | - | - | - |
| North Lakes | 3 | 3 | - | 94 | 42 | 31.33 | - | - | - | - | - | - | - | - | - | - | - | - | - | - |
| Paddy Clifton No1 | 15 | 15 | 4 | 313 | 113* | 28.45 | - | 1 | - | - | - | - | - | - | - | - | - | 5 | - | - |
| Paddy Clifton No2 | 10 | 9 | 2 | 144 | 30 | 20.57 | - | - | - | 3 | - | 27 | - | - | 0-27 | - | - | 3 | - | 1 |
| Pat Morley | 3 | 4 | - | 25 | 12 | 6.25 | - | - | - | - | - | - | - | - | - | - | - | 1 | - | - |
| Paul Oval | 2 | 3 | - | 31 | 25 | 10.33 | - | - | - | 7 | - | 36 | - | - | 0-11 | - | - | - | - | - |
| Rogers Park #2 | 2 | 2 | - | 5 | 4 | 2.50 | - | - | - | - | - | - | - | - | - | - | - | 2 | - | - |
| Saratoga Oval | 3 | 2 | - | 88 | 88 | 44.00 | - | - | 1 | 5 | - | 39 | - | - | 0-39 | - | - | 1 | - | - |
| Sohier Park | 5 | 6 | 2 | 97 | 35* | 24.25 | - | - | - | 12 | 3 | 40 | 4 | 10.00 | 4-40 | - | - | 3 | - | - |
| St Edwards | 1 | 1 | - | 1 | 1 | 1.00 | - | - | - | 3 | - | 13 | 1 | 13.00 | 1-13 | - | - | 1 | - | - |
| Tacoma | 3 | 4 | 1 | 51 | 31* | 17.00 | - | - | - | 2 | 1 | 3 | 2 | 1.50 | 2-3 | - | - | 1 | - | - |
| Terrigal Haven | 7 | 5 | 1 | 16 | 8* | 4.00 | - | - | - | 10 | - | 54 | 1 | 54.00 | 1-29 | - | - | 1 | - | - |
| Tunkuwallin | 2 | 2 | - | 6 | 5 | 3.00 | - | - | - | 8 | - | 38 | 1 | 38.00 | 1-38 | - | - | - | - | - |
| Umina #2 | 2 | 2 | - | 15 | 15 | 7.50 | - | - | - | 4 | 2 | 13 | 1 | 13.00 | 1-13 | - | - | 2 | - | - |
| Woy Woy #1 | 1 | 2 | - | 4 | 4 | 2.00 | - | - | - | - | - | - | - | - | - | - | - | - | - | - |
| Woy Woy #2 | 1 | 1 | - | 48 | 48 | 48.00 | - | - | - | - | - | - | - | - | - | - | - | - | - | - |
Stats by Cricket Statz | Last updated 27-Apr-2025.