Matthew Duhigg
All Matches, All Grades, Narara, 02-Nov-1935 to 15-Mar-2025
The Var is the variance of the scores to the mean. It is a measure of how reliable the batsman is at reaching their average. A low variance indicates the batsman will often get scores close to his average. A high variance indicates his scores are fairly unpredictable.
| Mat | Cts | ROs | Sts | GFs | GFWon |
|---|---|---|---|---|---|
| 47 | 19 | - | - | 2 | 1 |
Results by Season
| Season | Mat | Inn | NO | Runs | HS | Ave | SR | 100 | 50 | Overs | Maid | RunsA | Wkts | Ave | Best | 10W | 5WI | Cts | Sts | ROs |
|---|---|---|---|---|---|---|---|---|---|---|---|---|---|---|---|---|---|---|---|---|
| 2001/02 | 12 | 6 | 1 | 65 | 25 | 13.00 | - | - | - | 147.5 | 41 | 288 | 19 | 15.16 | 5-33 | - | 1 | 7 | - | - |
| 2002/03 | 11 | 8 | 3 | 89 | 35 | 17.80 | - | - | - | 157 | 38 | 398 | 24 | 16.58 | 5-35 | - | 2 | 3 | - | - |
| 2004/05 | 11 | 11 | 5 | 65 | 20* | 10.83 | - | - | - | 112.3 | 31 | 271 | 15 | 18.07 | 4-28 | - | - | 2 | - | - |
| 2005/06 | 13 | 6 | 3 | 17 | 12* | 5.67 | - | - | - | 127.3 | 24 | 392 | 13 | 30.15 | 2-13 | - | - | 7 | - | - |
Results by Grade
| Grade | Mat | Inn | NO | Runs | HS | Ave | SR | 100 | 50 | Overs | Maid | RunsA | Wkts | Ave | Best | 10W | 5WI | Cts | Sts | ROs |
|---|---|---|---|---|---|---|---|---|---|---|---|---|---|---|---|---|---|---|---|---|
| 1st Grade | 31 | 21 | 10 | 134 | 35 | 12.18 | - | - | - | 360 | 85 | 947 | 47 | 20.15 | 5-35 | - | 2 | 12 | - | - |
| 2nd Grade | 15 | 9 | 2 | 102 | 25 | 14.57 | - | - | - | 176.5 | 47 | 374 | 23 | 16.26 | 5-33 | - | 1 | 7 | - | - |
| NSW Country Cup | 1 | 1 | - | - | - | - | - | - | - | 8 | 2 | 28 | 1 | 28.00 | 1-28 | - | - | - | - | - |
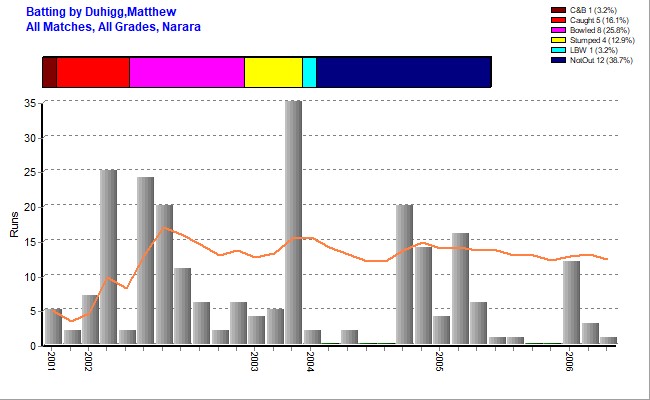
Batting Statistics
| Inns | NOs | Runs | HS | Ave | Var% | 50s | 100s | 4s | 6s | Ret |
|---|---|---|---|---|---|---|---|---|---|---|
| 31 | 12 | 236 | 35 Vs UCC 2002/03 | 12.42 | 85.64% | - | - | 14 | 1 | - |
Results by Batting Position
| Position | Inn | NO | Runs | HS | Ave | SR | 100 | 50 |
|---|---|---|---|---|---|---|---|---|
| 7 | 1 | - | 5 | 5 | 5.00 | - | - | - |
| 9 | 1 | - | 35 | 35 | 35.00 | - | - | - |
| 10 | 20 | 6 | 151 | 25 | 10.79 | - | - | - |
| 11 | 9 | 6 | 45 | 20* | 15.00 | - | - | - |
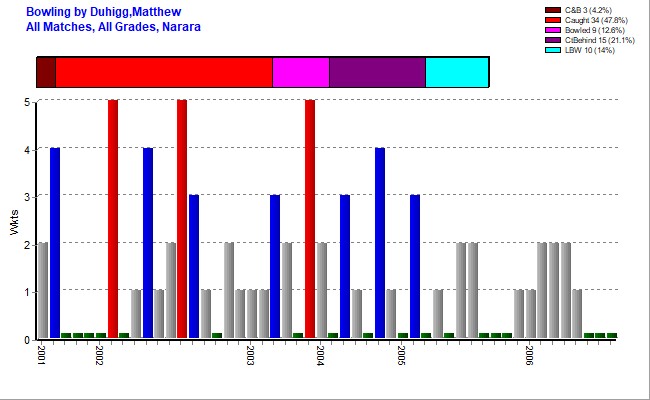
Bowling Statistics
| Overs | Maids | RunsA | Wkts | Best | Ave | 5WI | 10WM | Econ | SR |
|---|---|---|---|---|---|---|---|---|---|
| 544.5 | 134 | 1349 | 71 | 5-33 Vs WWCC 2001/02 | 19.00 | 3 | - | 2.48 | 46.04 |
Bowling Highlights
| O-M-R-W | Team | Vs | Ground | Grade | Date |
|---|---|---|---|---|---|
| 18-5-35-5 | Narara 1st | Umina | Gavenlock Oval | 1st Grade | 01-Mar-2003 |
| 17-5-42-5 | Narara 1st | Wyong | Baker Park | 1st Grade | 05-Oct-2002 |
| 18-6-33-5 | Narara 2nd | Woy Woy | Rogers Park | 2nd Grade | 12-Jan-2002 |
First Match
| Batting | Bowling | Team | Vs | Ground | Date |
|---|---|---|---|---|---|
| dnb | 2-9 | Narara 2nd | Lisarow | Gavenlock Oval | 06-Oct-2001 |
Results by Opposition Team
| Opposition | Mat | Inn | NO | Runs | HS | Ave | SR | 100 | 50 | Overs | Maid | RunsA | Wkts | Ave | Best | 10W | 5WI | Cts | Sts | ROs |
|---|---|---|---|---|---|---|---|---|---|---|---|---|---|---|---|---|---|---|---|---|
| Country Cup | 1 | 1 | - | - | - | - | - | - | - | 8 | 2 | 28 | 1 | 28.00 | 1-28 | - | - | - | - | - |
| Doyalson | 4 | 3 | 1 | 40 | 25 | 20.00 | - | - | - | 51 | 13 | 96 | 9 | 10.67 | 3-31 | - | - | 2 | - | - |
| Gosford | 4 | 2 | - | 15 | 11 | 7.50 | - | - | - | 48 | 11 | 138 | 2 | 69.00 | 1-22 | - | - | 1 | - | - |
| Kincumber | 4 | 3 | 3 | 9 | 5* | - | - | - | - | 44 | 12 | 114 | 5 | 22.80 | 2-19 | - | - | 2 | - | - |
| Lisarow | 6 | 4 | 2 | 46 | 24* | 23.00 | - | - | - | 68 | 22 | 167 | 7 | 23.86 | 2-9 | - | - | 5 | - | - |
| Mountains | 3 | 1 | 1 | 20 | 20* | - | - | - | - | 45.2 | 12 | 107 | 8 | 13.38 | 4-28 | - | - | 1 | - | - |
| Terrigal-Matcham | 5 | 2 | - | 8 | 6 | 4.00 | - | - | - | 54 | 11 | 148 | 6 | 24.67 | 3-21 | - | - | 1 | - | - |
| The Entrance | 6 | 5 | 2 | 28 | 16 | 9.33 | - | - | - | 84 | 17 | 206 | 4 | 51.50 | 3-40 | - | - | 1 | - | - |
| Toukley | 2 | 1 | 1 | 20 | 20* | - | - | - | - | 17 | 4 | 51 | 3 | 17.00 | 3-28 | - | - | 1 | - | - |
| Umina | 4 | 3 | 1 | 39 | 35 | 19.50 | - | - | - | 56.3 | 12 | 126 | 11 | 11.45 | 5-35 | - | 1 | 1 | - | - |
| Woy Woy | 4 | 3 | 1 | 9 | 7 | 4.50 | - | - | - | 49 | 13 | 108 | 10 | 10.80 | 5-33 | - | 1 | 2 | - | - |
| Wyong | 4 | 3 | - | 2 | 2 | 0.67 | - | - | - | 20 | 5 | 60 | 5 | 12.00 | 5-42 | - | 1 | 2 | - | - |
Results by Ground
| Ground | Mat | Inn | NO | Runs | HS | Ave | SR | 100 | 50 | Overs | Maid | RunsA | Wkts | Ave | Best | 10W | 5WI | Cts | Sts | ROs |
|---|---|---|---|---|---|---|---|---|---|---|---|---|---|---|---|---|---|---|---|---|
| Adcock Park | 3 | 1 | 1 | 20 | 20* | - | - | - | - | 45.2 | 12 | 107 | 8 | 13.38 | 4-28 | - | - | 1 | - | - |
| Baker Park | 2 | 1 | - | - | - | - | - | - | - | 17 | 5 | 42 | 5 | 8.40 | 5-42 | - | 1 | 2 | - | - |
| Duffys Road | 3 | 1 | - | 6 | 6 | 6.00 | - | - | - | 29.3 | 6 | 92 | 2 | 46.00 | 2-39 | - | - | 1 | - | - |
| Erina | 3 | 2 | 1 | 6 | 5* | 6.00 | - | - | - | 39 | 11 | 106 | 2 | 53.00 | 2-47 | - | - | 2 | - | - |
| Fagans Park | 3 | 1 | - | 4 | 4 | 4.00 | - | - | - | 38 | 8 | 114 | 1 | 114.00 | 1-22 | - | - | 1 | - | - |
| Gavenlock Oval | 21 | 15 | 5 | 145 | 35 | 14.50 | - | - | - | 244 | 62 | 536 | 34 | 15.76 | 5-35 | - | 1 | 8 | - | - |
| Harry Moore | 1 | 1 | 1 | 20 | 20* | - | - | - | - | 12 | 3 | 28 | 3 | 9.33 | 3-28 | - | - | - | - | - |
| Lemon Tree Oval | 1 | 1 | - | 2 | 2 | 2.00 | - | - | - | - | - | - | - | - | - | - | - | - | - | - |
| Mandalong Oval | 1 | 1 | - | 4 | 4 | 4.00 | - | - | - | 16 | 1 | 60 | 1 | 60.00 | 1-60 | - | - | - | - | - |
| Rogers Park | 4 | 3 | 1 | 9 | 7 | 4.50 | - | - | - | 49 | 13 | 108 | 10 | 10.80 | 5-33 | - | 1 | 2 | - | - |
| Sohier Park | 3 | 2 | 1 | 18 | 12* | 18.00 | - | - | - | 29 | 7 | 85 | 3 | 28.33 | 2-37 | - | - | 2 | - | - |
| Taylor Park | 1 | 1 | 1 | - | 0* | - | - | - | - | 16 | 4 | 52 | - | - | 0-18 | - | - | - | - | - |
| Umina #1 | 1 | 1 | 1 | 2 | 2* | - | - | - | - | 10 | 2 | 19 | 2 | 9.50 | 2-19 | - | - | - | - | - |
Stats by Cricket Statz | Last updated 27-Apr-2025.