Stuart Owen
All Matches, All Grades, Narara, 02-Nov-1935 to 15-Mar-2025
The Var is the variance of the scores to the mean. It is a measure of how reliable the batsman is at reaching their average. A low variance indicates the batsman will often get scores close to his average. A high variance indicates his scores are fairly unpredictable.
| Mat | Cts | ROs | Sts | GFs | GFWon |
|---|---|---|---|---|---|
| 224 | 121 | 5 | 1 | 6 | 5 |
Results by Season
| Season | Mat | Inn | NO | Runs | HS | Ave | SR | 100 | 50 | Overs | Maid | RunsA | Wkts | Ave | Best | 10W | 5WI | Cts | Sts | ROs |
|---|---|---|---|---|---|---|---|---|---|---|---|---|---|---|---|---|---|---|---|---|
| 2001/02 | 13 | 12 | 3 | 232 | 79 | 25.78 | - | - | 1 | 49.3 | 5 | 208 | 19 | 10.95 | 7-65 | - | 2 | 9 | - | - |
| 2002/03 | 13 | 14 | 1 | 156 | 42 | 12.00 | - | - | - | 43.2 | 12 | 114 | 8 | 14.25 | 3-0 | - | - | 10 | - | - |
| 2003/04 | 11 | 11 | 1 | 78 | 30 | 7.80 | - | - | - | 53.4 | 10 | 181 | 5 | 36.20 | 3-7 | - | - | 6 | 1 | - |
| 2005/06 | 1 | 1 | - | 10 | 10 | 10.00 | - | - | - | - | - | - | - | - | - | - | - | 1 | - | - |
| 2007/08 | 10 | 13 | 2 | 218 | 37 | 19.82 | - | - | - | 89 | 12 | 303 | 20 | 15.15 | 3-20 | - | - | 11 | - | - |
| 2008/09 | 14 | 15 | 3 | 494 | 98 | 41.17 | - | - | 3 | 95.2 | 28 | 245 | 24 | 10.21 | 4-40 | - | - | 9 | - | 1 |
| 2009/10 | 12 | 14 | 1 | 153 | 30 | 11.77 | - | - | - | 43 | 13 | 94 | 9 | 10.44 | 2-4 | - | - | 1 | - | - |
| 2010/11 | 13 | 14 | 3 | 129 | 27 | 11.73 | - | - | - | 48.3 | 11 | 143 | 10 | 14.30 | 3-33 | - | - | 2 | - | - |
| 2011/12 | 12 | 11 | 5 | 210 | 63 | 35.00 | - | - | 1 | 62.4 | 9 | 207 | 14 | 14.79 | 4-30 | - | - | 12 | - | - |
| 2012/13 | 14 | 14 | 2 | 432 | 111* | 36.00 | - | 1 | 2 | 72.5 | 10 | 259 | 13 | 19.92 | 5-35 | - | 1 | 7 | - | - |
| 2013/14 | 13 | 14 | 2 | 169 | 46 | 14.08 | - | - | - | 131.5 | 18 | 474 | 29 | 16.34 | 6-67 | - | 2 | 5 | - | 2 |
| 2014/15 | 14 | 14 | 3 | 371 | 60* | 33.73 | - | - | 2 | 105.5 | 27 | 292 | 29 | 10.07 | 5-34 | - | 1 | 6 | - | - |
| 2015/16 | 7 | 7 | - | 87 | 29 | 12.43 | - | - | - | 53 | 8 | 162 | 9 | 18.00 | 3-43 | - | - | 3 | - | - |
| 2016/17 | 6 | 6 | 1 | 98 | 43 | 19.60 | - | - | - | 16 | 2 | 49 | 3 | 16.33 | 2-19 | - | - | 1 | - | 1 |
| 2017/18 | 14 | 12 | 1 | 199 | 39* | 18.09 | - | - | - | 148.5 | 41 | 323 | 32 | 10.09 | 5-21 | - | 2 | 6 | - | - |
| 2018/19 | 12 | 10 | 2 | 37 | 14 | 4.62 | - | - | - | 113.4 | 34 | 296 | 26 | 11.38 | 5-36 | - | 2 | 4 | - | - |
| 2019/20 | 16 | 12 | 6 | 58 | 22* | 9.67 | 20.00 | - | - | 90.5 | 12 | 296 | 18 | 16.44 | 3-11 | - | - | 8 | - | - |
| 2020/21 | 11 | 9 | 5 | 92 | 35 | 23.00 | - | - | - | 72.1 | 6 | 245 | 14 | 17.50 | 4-26 | - | - | 9 | - | - |
| 2021/22 | 12 | 10 | 3 | 93 | 43* | 13.29 | - | - | - | 66.2 | 9 | 172 | 16 | 10.75 | 3-8 | - | - | 11 | - | 1 |
| 2022/23 | 6 | 8 | - | 52 | 33 | 6.50 | - | - | - | 37 | 4 | 127 | 3 | 42.33 | 1-15 | - | - | - | - | - |
Results by Grade
| Grade | Mat | Inn | NO | Runs | HS | Ave | SR | 100 | 50 | Overs | Maid | RunsA | Wkts | Ave | Best | 10W | 5WI | Cts | Sts | ROs |
|---|---|---|---|---|---|---|---|---|---|---|---|---|---|---|---|---|---|---|---|---|
| 2nd Grade | 68 | 64 | 15 | 461 | 43* | 9.41 | 20.00 | - | - | 381.2 | 78 | 1058 | 80 | 13.22 | 5-36 | - | 1 | 23 | - | 1 |
| 3rd Grade | 57 | 57 | 7 | 750 | 48 | 15.00 | - | - | - | 350.2 | 77 | 1015 | 77 | 13.18 | 7-65 | - | 5 | 31 | - | - |
| 4th Grade | 34 | 35 | 8 | 545 | 79 | 20.19 | - | - | 1 | 204.1 | 25 | 690 | 39 | 17.69 | 4-26 | - | - | 27 | 1 | 1 |
| 5th Grade | 11 | 11 | 2 | 412 | 98 | 45.78 | - | - | 3 | 84.2 | 27 | 195 | 20 | 9.75 | 3-0 | - | - | 9 | - | 1 |
| Division 1 | 7 | 8 | 2 | 151 | 46 | 25.17 | - | - | - | 58.3 | 9 | 233 | 10 | 23.30 | 3-39 | - | - | 2 | - | - |
| Division 2 | 4 | 2 | 1 | 14 | 8* | 14.00 | - | - | - | 29 | 4 | 76 | 7 | 10.86 | 3-17 | - | - | 4 | - | - |
| Division 3 | 41 | 42 | 8 | 1016 | 111* | 29.88 | - | 1 | 5 | 282.4 | 50 | 913 | 68 | 13.43 | 6-67 | - | 4 | 24 | - | 2 |
| NSW Country Cup | 2 | 2 | 1 | 19 | 18 | 19.00 | - | - | - | 3 | 1 | 10 | - | - | 0-10 | - | - | 1 | - | - |
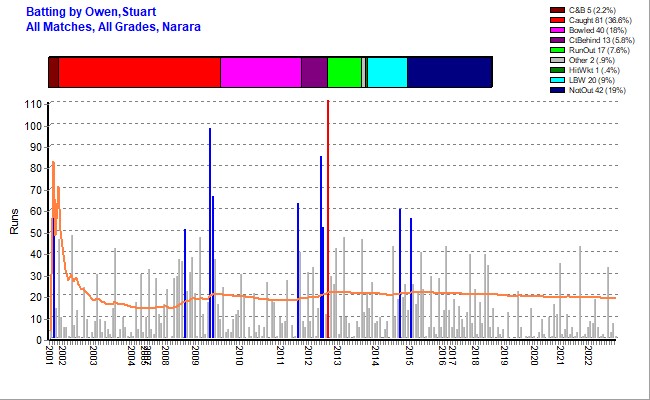
Batting Statistics
| Inns | NOs | Runs | HS | Ave | Var% | 50s | 100s | 4s | 6s | Ret |
|---|---|---|---|---|---|---|---|---|---|---|
| 221 | 44 | 3368 | 111* Vs UCC 2012/13 | 19.03 | 88.67% | 9 | 1 | 278 | 7 | 2 |
Batting Highlights
| Score/s | Team | Vs | Ground | Grade | Date |
|---|---|---|---|---|---|
| 56{ct} | Narara 3rd Divis | Terrigal-Matcham | Paul Oval | Division 3 | 17-Jan-2015 |
| 60* | Narara 3rd Divis | The Entrance | Alan Davidson | Division 3 | 08-Nov-2014 |
| 111* | Narara 3rd Divis | Umina | Carrington St | Division 3 | 10-Nov-2012 |
| 52{lb} | Narara 3rd Divis | Terrigal-Matcham | Carrington St | Division 3 | 13-Oct-2012 |
| 85* | Narara 3rd Divis | Woy Woy | Rogers Park #2 | Division 3 | 06-Oct-2012 |
| 63{ct} | Narara 3rd Divis | Kincumber | Ozanam Oval | Division 3 | 05-Nov-2011 |
| 66{ct} | Narara 5th | Kincumber | EDSACC Sth | 5th Grade | 14-Mar-2009 |
| 98{ro} | Narara 5th | Toukley | Halekulani Oval | 5th Grade | 28-Feb-2009 |
| 51* | Narara 5th | Warnervale | Alan Davidson | 5th Grade | 18-Oct-2008 |
| 79{b} | Narara 4th | Mountains | Kariong | 4th Grade | 20-Oct-2001 |
Results by Batting Position
| Position | Inn | NO | Runs | HS | Ave | SR | 100 | 50 |
|---|---|---|---|---|---|---|---|---|
| Open | 100 | 13 | 1714 | 111* | 19.70 | 23.08 | 1 | 5 |
| 3 | 20 | 1 | 414 | 98 | 21.79 | - | - | 2 |
| 4 | 15 | 1 | 270 | 79 | 19.29 | - | - | 1 |
| 5 | 17 | 3 | 241 | 51* | 17.21 | - | - | 1 |
| 6 | 11 | 1 | 169 | 46* | 16.90 | - | - | - |
| 7 | 19 | 7 | 170 | 38* | 14.17 | - | - | - |
| 8 | 14 | 4 | 217 | 37 | 21.70 | - | - | - |
| 9 | 10 | 5 | 102 | 46 | 20.40 | - | - | - |
| 10 | 7 | 3 | 54 | 32 | 13.50 | - | - | - |
| 11 | 7 | 5 | 17 | 8 | 8.50 | - | - | - |
| 12 | 1 | 1 | - | 0* | - | - | - | - |
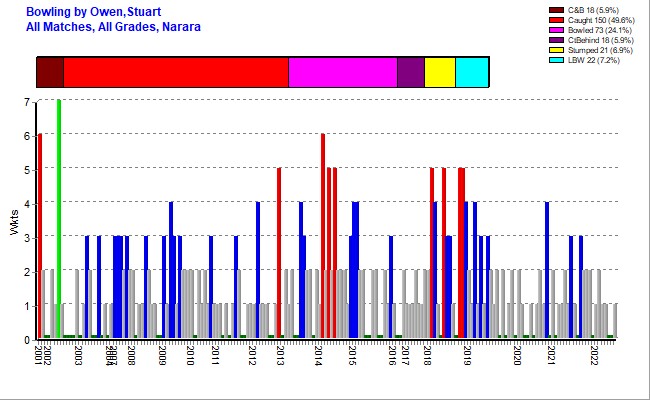
Bowling Statistics
| Overs | Maids | RunsA | Wkts | Best | Ave | 5WI | 10WM | Econ | SR |
|---|---|---|---|---|---|---|---|---|---|
| 1393.2 | 271 | 4190 | 301 | 7-65 Vs DWCC 2001/02 | 13.92 | 10 | - | 3.01 | 27.77 |
Bowling Highlights
| Event | Vs | Ground | Date |
|---|---|---|---|
| Hat Trick | Umina | Carrington St | 01-Mar-2003 |
| O-M-R-W | Team | Vs | Ground | Grade | Date |
|---|---|---|---|---|---|
| 21-9-36-5 | Narara 2nd | Terrigal-Matcham | Gavenlock Oval | 2nd Grade | 24-Nov-2018 |
| 14-5-36-5 | Narara 3rd | Southern Spirit | Carrington St | 3rd Grade | 10-Nov-2018 |
| 12-2-21-5 | Narara 3rd | Wyong | Kanwal Park | 3rd Grade | 24-Feb-2018 |
| 18-7-34-5 | Narara 3rd | Warnervale | Carrington St | 3rd Grade | 13-Jan-2018 |
| 8-1-34-5 | Narara 3rd Divis | Northern Power | Doyalson #2 | Division 3 | 04-Oct-2014 |
| 5.3-1-7-5 | Narara 3rd Divis | Umina | Col Gooley Oval | Division 3 | 01-Feb-2014 |
| 24.1-3-67-6 | Narara 3rd Divis | The Entrance | Mt Penang | Division 3 | 11-Jan-2014 |
| 16.3-3-35-5 | Narara 3rd Divis | Kincumber | McKillopOval | Division 3 | 01-Dec-2012 |
| 12-0-65-7 | Narara 3rd | Doyalson | Doyalson #3 | 3rd Grade | 26-Jan-2002 |
| 20-2-52-6 | Narara 3rd | The Entrance | Bateau Bay North | 3rd Grade | 03-Nov-2001 |
First Match
| Batting | Bowling | Team | Vs | Ground | Date |
|---|---|---|---|---|---|
| 4* | Narara 3rd | Lisarow | Sohier Park | 06-Oct-2001 |
Results by Opposition Team
| Opposition | Mat | Inn | NO | Runs | HS | Ave | SR | 100 | 50 | Overs | Maid | RunsA | Wkts | Ave | Best | 10W | 5WI | Cts | Sts | ROs |
|---|---|---|---|---|---|---|---|---|---|---|---|---|---|---|---|---|---|---|---|---|
| Belmont DCC | 1 | 1 | 1 | 1 | 1* | - | - | - | - | 3 | 1 | 10 | - | - | 0-10 | - | - | - | - | - |
| Brisbane Water | 9 | 10 | 2 | 69 | 25 | 8.62 | - | - | - | 86.4 | 15 | 281 | 17 | 16.53 | 4-24 | - | - | 4 | - | - |
| Doyalson | 6 | 6 | - | 63 | 30 | 10.50 | - | - | - | 39 | 6 | 186 | 12 | 15.50 | 7-65 | - | 1 | 2 | - | - |
| Gosford | 6 | 5 | - | 136 | 48 | 27.20 | - | - | - | 25.5 | 4 | 83 | 6 | 13.83 | 3-40 | - | - | 3 | 1 | - |
| Kincumber | 27 | 28 | 4 | 384 | 66 | 16.00 | - | - | 2 | 135.3 | 25 | 404 | 29 | 13.93 | 5-35 | - | 1 | 11 | - | 2 |
| Lisarow | 23 | 22 | 3 | 214 | 30 | 11.26 | - | - | - | 181 | 41 | 510 | 29 | 17.59 | 4-14 | - | - | 19 | - | - |
| Mountains | 9 | 9 | 2 | 160 | 79 | 22.86 | - | - | 1 | 45.5 | 13 | 99 | 10 | 9.90 | 4-30 | - | - | 7 | - | - |
| Muswellbrook DCA | 1 | 1 | - | 18 | 18 | 18.00 | - | - | - | - | - | - | - | - | - | - | - | 1 | - | - |
| Northern Power | 15 | 12 | 3 | 201 | 43 | 22.33 | - | - | - | 112 | 22 | 311 | 28 | 11.11 | 5-34 | - | 1 | 4 | - | - |
| Southern Spirit | 9 | 8 | 1 | 93 | 39 | 13.29 | - | - | - | 64.2 | 11 | 202 | 14 | 14.43 | 5-36 | - | 1 | 12 | - | - |
| Terrigal-Matcham | 26 | 28 | 8 | 454 | 56 | 22.70 | - | - | 2 | 186.2 | 33 | 579 | 31 | 18.68 | 5-36 | - | 1 | 8 | - | - |
| The Entrance | 25 | 24 | 3 | 336 | 60* | 16.00 | 23.08 | - | 1 | 151 | 26 | 486 | 31 | 15.68 | 6-52 | - | 2 | 17 | - | 1 |
| Toukley | 11 | 11 | 1 | 241 | 98 | 24.10 | - | - | 1 | 42 | 9 | 154 | 9 | 17.11 | 3-39 | - | - | 11 | - | - |
| Umina | 12 | 14 | 4 | 215 | 111* | 21.50 | - | 1 | - | 53.3 | 8 | 149 | 15 | 9.93 | 5-7 | - | 1 | 4 | - | 1 |
| Warnervale | 13 | 12 | 3 | 268 | 51* | 29.78 | - | - | 1 | 70.3 | 16 | 225 | 16 | 14.06 | 5-34 | - | 1 | 6 | - | 1 |
| Woy Woy | 10 | 10 | 5 | 252 | 85* | 50.40 | - | - | 1 | 81.4 | 23 | 198 | 26 | 7.62 | 3-0 | - | - | 6 | - | - |
| Wyong | 21 | 20 | 4 | 263 | 42 | 16.44 | - | - | - | 115.1 | 18 | 313 | 28 | 11.18 | 5-21 | - | 1 | 6 | - | - |
Results by Ground
| Ground | Mat | Inn | NO | Runs | HS | Ave | SR | 100 | 50 | Overs | Maid | RunsA | Wkts | Ave | Best | 10W | 5WI | Cts | Sts | ROs |
|---|---|---|---|---|---|---|---|---|---|---|---|---|---|---|---|---|---|---|---|---|
| Adcock #3 | 1 | 1 | - | 17 | 17 | 17.00 | - | - | - | - | - | - | - | - | - | - | - | 2 | 1 | - |
| Adcock #7 | 1 | 1 | - | 9 | 9 | 9.00 | - | - | - | 2 | - | 18 | - | - | 0-18 | - | - | 1 | - | - |
| Adcock Park | 5 | 6 | 2 | 19 | 7 | 4.75 | - | - | - | 29.4 | 8 | 79 | 6 | 13.17 | 3-8 | - | - | 2 | - | - |
| Alan Davidson | 11 | 12 | 4 | 302 | 60* | 37.75 | - | - | 2 | 77.1 | 17 | 248 | 19 | 13.05 | 4-40 | - | - | 6 | - | 1 |
| Baker Park | 5 | 4 | 1 | 40 | 24 | 13.33 | - | - | - | 30.4 | 5 | 66 | 4 | 16.50 | 2-20 | - | - | - | - | - |
| Bateau Bay North | 1 | 1 | - | 14 | 14 | 14.00 | - | - | - | 20 | 2 | 52 | 6 | 8.67 | 6-52 | - | 1 | 1 | - | - |
| Bill Sohier Park (Sohie | 1 | 1 | - | 3 | 3 | 3.00 | - | - | - | 4 | - | 21 | - | - | 0-21 | - | - | 1 | - | - |
| Bill Sohier Park (Sohie | 1 | 1 | - | 14 | 14 | 14.00 | - | - | - | 11 | 2 | 43 | - | - | 0-43 | - | - | 1 | - | - |
| Blue Haven | 1 | 1 | - | 4 | 4 | 4.00 | - | - | - | 9 | - | 45 | - | - | 0-45 | - | - | - | - | - |
| Carrington St | 41 | 44 | 5 | 776 | 111* | 19.90 | - | 1 | 1 | 251 | 47 | 844 | 59 | 14.31 | 5-34 | - | 2 | 31 | - | - |
| Col Gooley Oval | 8 | 8 | 1 | 92 | 39 | 13.14 | - | - | - | 32.1 | 3 | 98 | 14 | 7.00 | 5-7 | - | 1 | 4 | - | 1 |
| Darren Kennedy | 1 | - | - | - | - | - | - | - | - | 8 | 2 | 17 | 2 | 8.50 | 2-17 | - | - | 1 | - | - |
| Doyalson #2 | 3 | 2 | - | 53 | 43 | 26.50 | - | - | - | 30 | 6 | 95 | 7 | 13.57 | 5-34 | - | 1 | 1 | - | - |
| Doyalson #3 | 1 | 1 | - | 1 | 1 | 1.00 | - | - | - | 18 | 2 | 106 | 8 | 13.25 | 7-65 | - | 1 | - | - | - |
| Duffys Road | 5 | 6 | 1 | 65 | 26 | 13.00 | - | - | - | 22 | 4 | 66 | 5 | 13.20 | 2-20 | - | - | 1 | - | - |
| EDSACC North | 4 | 4 | - | 32 | 14 | 8.00 | - | - | - | 18.4 | 3 | 44 | 4 | 11.00 | 2-10 | - | - | 4 | - | - |
| EDSACC Sth | 2 | 2 | - | 103 | 66 | 51.50 | - | - | 1 | 6.1 | 6 | - | 3 | - | 3-0 | - | - | 1 | - | - |
| Erina | 4 | 3 | - | 24 | 20 | 8.00 | - | - | - | 27 | 6 | 82 | 6 | 13.67 | 4-41 | - | - | 1 | - | - |
| Fagans Park | 19 | 19 | 3 | 211 | 43* | 13.19 | - | - | - | 145.4 | 23 | 417 | 22 | 18.95 | 4-24 | - | - | 12 | - | 1 |
| Frost Reserve | 1 | 1 | - | 31 | 31 | 31.00 | - | - | - | 2 | - | 8 | - | - | 0-8 | - | - | - | - | - |
| Gavenlock Oval | 37 | 36 | 12 | 326 | 46 | 13.58 | 20.00 | - | - | 226.1 | 44 | 717 | 48 | 14.94 | 5-36 | - | 1 | 9 | - | - |
| Halekulani Oval | 4 | 4 | - | 119 | 98 | 29.75 | - | - | 1 | 16 | 5 | 41 | 3 | 13.67 | 2-0 | - | - | 1 | - | - |
| Hamlyn Terrace Oval [TB | 4 | 4 | - | 43 | 35 | 10.75 | - | - | - | 12 | - | 52 | - | - | 0-22 | - | - | 2 | - | - |
| Harry Moore | 4 | 4 | 1 | 55 | 31* | 18.33 | - | - | - | 17 | 1 | 70 | 3 | 23.33 | 1-15 | - | - | 3 | - | - |
| Hasslett Oval | 2 | 2 | - | 14 | 9 | 7.00 | - | - | - | 1 | - | 9 | - | - | 0-9 | - | - | 2 | - | - |
| Hylton Moore | 1 | 1 | - | 33 | 33 | 33.00 | - | - | - | 6 | - | 17 | - | - | 0-17 | - | - | - | - | - |
| Jubilee Park | 2 | 1 | - | 5 | 5 | 5.00 | - | - | - | 6 | 4 | 5 | 1 | 5.00 | 1-5 | - | - | - | - | - |
| Kanwal Park | 3 | 3 | 2 | 58 | 39* | 58.00 | - | - | - | 28.3 | 4 | 67 | 11 | 6.09 | 5-21 | - | 1 | 2 | - | - |
| Kariong | 5 | 4 | - | 96 | 79 | 24.00 | - | - | 1 | 18 | 5 | 37 | 4 | 9.25 | 3-20 | - | - | 4 | - | 1 |
| Kurraba | 2 | 2 | - | 30 | 22 | 15.00 | - | - | - | 25 | 6 | 48 | 1 | 48.00 | 1-33 | - | - | 3 | - | - |
| Mandalong Oval | 2 | 1 | - | 16 | 16 | 16.00 | - | - | - | 7 | 2 | 20 | 2 | 10.00 | 2-13 | - | - | 2 | - | - |
| Mascord | 2 | 3 | 1 | 59 | 40* | 29.50 | - | - | - | - | - | - | - | - | - | - | - | - | - | - |
| McEvoy | 3 | 3 | 1 | 15 | 8* | 7.50 | - | - | - | 17 | 3 | 38 | 2 | 19.00 | 1-16 | - | - | - | - | - |
| McKillopOval | 4 | 4 | 1 | 77 | 34 | 25.67 | - | - | - | 47.3 | 10 | 106 | 13 | 8.15 | 5-35 | - | 1 | - | - | - |
| Mt Penang | 3 | 3 | - | 16 | 10 | 5.33 | - | - | - | 36.1 | 4 | 102 | 9 | 11.33 | 6-67 | - | 1 | 2 | - | 1 |
| Ozanam Oval | 1 | 1 | - | 63 | 63 | 63.00 | - | - | 1 | 5 | - | 34 | - | - | 0-34 | - | - | - | - | - |
| Paddy Clifton No1 | 1 | 1 | - | 21 | 21 | 21.00 | - | - | - | - | - | - | - | - | - | - | - | - | - | - |
| Paul Oval | 3 | 3 | 1 | 93 | 56 | 46.50 | - | - | 1 | 25 | 7 | 74 | 5 | 14.80 | 4-37 | - | - | 2 | - | - |
| Rogers Park | 1 | - | - | - | - | - | - | - | - | 15 | 3 | 31 | 5 | 6.20 | 3-17 | - | - | 1 | - | - |
| Rogers Park #2 | 3 | 3 | 3 | 149 | 85* | - | - | - | 1 | 26 | 8 | 72 | 8 | 9.00 | 3-13 | - | - | 4 | - | - |
| Sohier Park | 9 | 9 | 2 | 97 | 30 | 13.86 | - | - | - | 75.5 | 24 | 189 | 15 | 12.60 | 4-14 | - | - | 3 | - | - |
| Tacoma | 8 | 8 | 2 | 113 | 42 | 18.83 | - | - | - | 22 | 3 | 55 | 4 | 13.75 | 2-11 | - | - | 7 | - | - |
| Taylor Park | 2 | 1 | - | 40 | 40 | 40.00 | - | - | - | 8 | 1 | 33 | - | - | 0-12 | - | - | 1 | - | - |
| Woongarrah Oval | 2 | 2 | 1 | 20 | 19 | 20.00 | - | - | - | 9 | 1 | 24 | 2 | 12.00 | 2-14 | - | - | 3 | - | - |
Stats by Cricket Statz | Last updated 27-Apr-2025.