Adam Montgomery
All Matches, All Grades, Narara, 04-Oct-2025 to 30-Nov-2025
The Var is the variance of the scores to the mean. It is a measure of how reliable the batsman is at reaching their average. A low variance indicates the batsman will often get scores close to his average. A high variance indicates his scores are fairly unpredictable.
| Mat | Cts | ROs | Sts | GFs | GFWon |
|---|---|---|---|---|---|
| 7 | - | - | - | - | - |
Results by Season
| Season | Mat | Inn | NO | Runs | HS | Ave | SR | 100 | 50 | Overs | Maid | RunsA | Wkts | Ave | Best | 10W | 5WI | Cts | Sts | ROs |
|---|---|---|---|---|---|---|---|---|---|---|---|---|---|---|---|---|---|---|---|---|
| 2025/26 | 7 | 6 | 1 | 63 | 17 | 12.60 | - | - | - | 39 | 8 | 162 | 9 | 18.00 | 3-12 | - | - | - | - | - |
Results by Grade
| Grade | Mat | Inn | NO | Runs | HS | Ave | SR | 100 | 50 | Overs | Maid | RunsA | Wkts | Ave | Best | 10W | 5WI | Cts | Sts | ROs |
|---|---|---|---|---|---|---|---|---|---|---|---|---|---|---|---|---|---|---|---|---|
| 5th Grade | 7 | 6 | 1 | 63 | 17 | 12.60 | - | - | - | 39 | 8 | 162 | 9 | 18.00 | 3-12 | - | - | - | - | - |
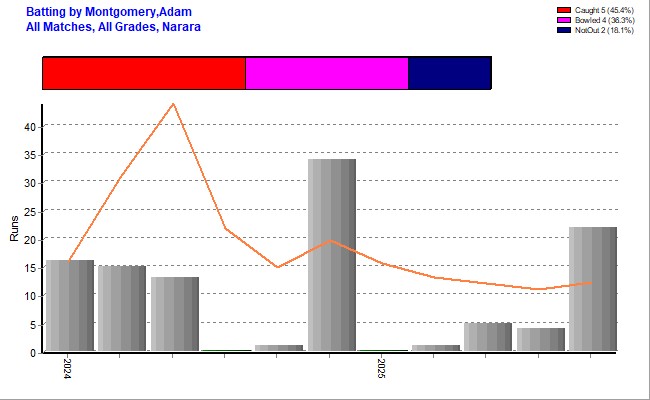
Batting Statistics
| Inns | NOs | Runs | HS | Ave | Var% | 50s | 100s | 4s | 6s | Ret |
|---|---|---|---|---|---|---|---|---|---|---|
| 6 | 1 | 63 | 17 Vs WCC 2025/26 | 12.60 | 49.87% | - | - | 7 | - | - |
Results by Batting Position
| Position | Inn | NO | Runs | HS | Ave | SR | 100 | 50 |
|---|---|---|---|---|---|---|---|---|
| 7 | 1 | - | 15 | 15 | 15.00 | - | - | - |
| 8 | 2 | - | 27 | 17 | 13.50 | - | - | - |
| 9 | 2 | 1 | 11 | 11* | 11.00 | - | - | - |
| 10 | 1 | - | 10 | 10 | 10.00 | - | - | - |
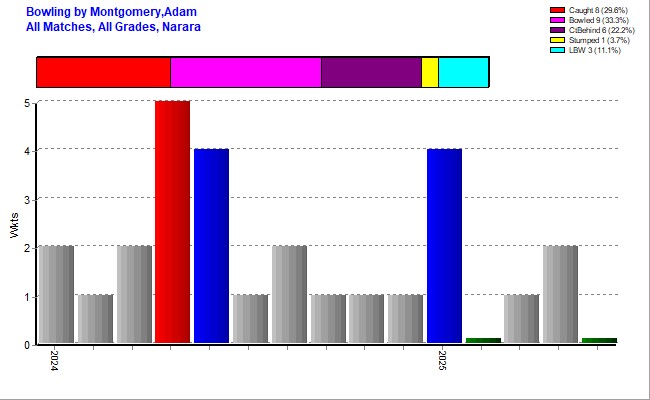
Bowling Statistics
| Overs | Maids | RunsA | Wkts | Best | Ave | 5WI | 10WM | Econ | SR |
|---|---|---|---|---|---|---|---|---|---|
| 39 | 8 | 162 | 9 | 3-12 Vs TECC 2025/26 | 18.00 | - | - | 4.15 | 26.00 |
First Match
| Batting | Bowling | Team | Vs | Ground | Date |
|---|---|---|---|---|---|
| 10{ct} | 1-25 | Narara 5th | Warnervale | Alan Davidson | 11-Oct-2025 |
Results by Opposition Team
| Opposition | Mat | Inn | NO | Runs | HS | Ave | SR | 100 | 50 | Overs | Maid | RunsA | Wkts | Ave | Best | 10W | 5WI | Cts | Sts | ROs |
|---|---|---|---|---|---|---|---|---|---|---|---|---|---|---|---|---|---|---|---|---|
| Gosford/Kariong | 1 | - | - | - | - | - | - | - | - | 4 | - | 31 | 1 | 31.00 | 1-31 | - | - | - | - | - |
| Lisarow | 1 | 1 | - | 10 | 10 | 10.00 | - | - | - | 8 | 1 | 29 | 3 | 9.67 | 3-29 | - | - | - | - | - |
| The Entrance | 2 | 2 | 1 | 26 | 15 | 26.00 | - | - | - | 11 | 2 | 47 | 3 | 15.67 | 3-12 | - | - | - | - | - |
| Warnervale | 2 | 2 | - | 10 | 10 | 5.00 | - | - | - | 16 | 5 | 55 | 2 | 27.50 | 1-25 | - | - | - | - | - |
| Wyong | 1 | 1 | - | 17 | 17 | 17.00 | - | - | - | - | - | - | - | - | - | - | - | - | - | - |
Results by Ground
| Ground | Mat | Inn | NO | Runs | HS | Ave | SR | 100 | 50 | Overs | Maid | RunsA | Wkts | Ave | Best | 10W | 5WI | Cts | Sts | ROs |
|---|---|---|---|---|---|---|---|---|---|---|---|---|---|---|---|---|---|---|---|---|
| Alan Davidson | 5 | 4 | - | 52 | 17 | 13.00 | - | - | - | 25 | 5 | 97 | 8 | 12.12 | 3-12 | - | - | - | - | - |
| Blue Haven | 1 | 1 | - | - | - | - | - | - | - | 8 | 3 | 30 | 1 | 30.00 | 1-30 | - | - | - | - | - |
| EDSACC North | 1 | 1 | 1 | 11 | 11* | - | - | - | - | 6 | - | 35 | - | - | 0-35 | - | - | - | - | - |
Stats by Cricket Statz | Last updated 30-Nov-2025.