Jeff Monin
All Matches, All Grades, Narara, 04-Oct-2025 to 30-Nov-2025
The Var is the variance of the scores to the mean. It is a measure of how reliable the batsman is at reaching their average. A low variance indicates the batsman will often get scores close to his average. A high variance indicates his scores are fairly unpredictable.
| Mat | Cts | ROs | Sts | GFs | GFWon |
|---|---|---|---|---|---|
| 2 | 1 | - | - | - | - |
Results by Season
| Season | Mat | Inn | NO | Runs | HS | Ave | SR | 100 | 50 | Overs | Maid | RunsA | Wkts | Ave | Best | 10W | 5WI | Cts | Sts | ROs |
|---|---|---|---|---|---|---|---|---|---|---|---|---|---|---|---|---|---|---|---|---|
| 2025/26 | 2 | 2 | - | 18 | 16 | 9.00 | - | - | - | 8 | 1 | 39 | 1 | 39.00 | 1-39 | - | - | 1 | - | - |
Results by Grade
| Grade | Mat | Inn | NO | Runs | HS | Ave | SR | 100 | 50 | Overs | Maid | RunsA | Wkts | Ave | Best | 10W | 5WI | Cts | Sts | ROs |
|---|---|---|---|---|---|---|---|---|---|---|---|---|---|---|---|---|---|---|---|---|
| 5th Grade | 2 | 2 | - | 18 | 16 | 9.00 | - | - | - | 8 | 1 | 39 | 1 | 39.00 | 1-39 | - | - | 1 | - | - |
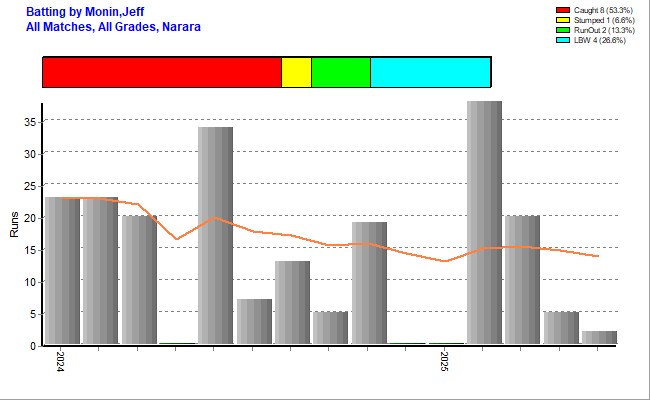
Batting Statistics
| Inns | NOs | Runs | HS | Ave | Var% | 50s | 100s | 4s | 6s | Ret |
|---|---|---|---|---|---|---|---|---|---|---|
| 2 | - | 18 | 16 Vs GKCC 2025/26 | 9.00 | 77.78% | - | - | 2 | - | - |
Results by Batting Position
| Position | Inn | NO | Runs | HS | Ave | SR | 100 | 50 |
|---|---|---|---|---|---|---|---|---|
| 3 | 1 | - | 16 | 16 | 16.00 | - | - | - |
| 8 | 1 | - | 2 | 2 | 2.00 | - | - | - |
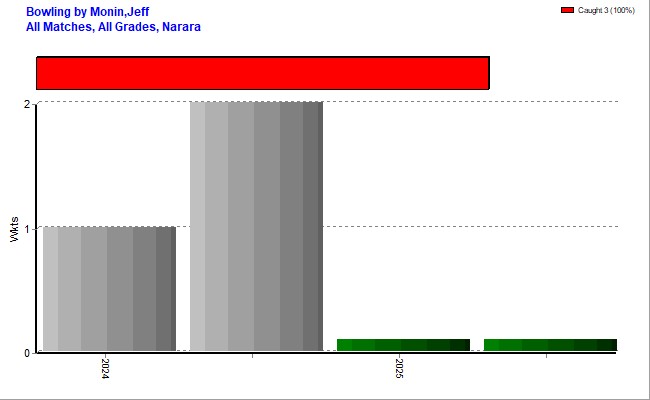
Bowling Statistics
| Overs | Maids | RunsA | Wkts | Best | Ave | 5WI | 10WM | Econ | SR |
|---|---|---|---|---|---|---|---|---|---|
| 8 | 1 | 39 | 1 | 1-39 Vs GKCC 2025/26 | 39.00 | - | - | 4.88 | 48.00 |
First Match
| Batting | Bowling | Team | Vs | Ground | Date |
|---|---|---|---|---|---|
| 16{st} | 1-39 | Narara 5th | Gosford/Kariong | Alan Davidson | 18-Oct-2025 |
Results by Opposition Team
| Opposition | Mat | Inn | NO | Runs | HS | Ave | SR | 100 | 50 | Overs | Maid | RunsA | Wkts | Ave | Best | 10W | 5WI | Cts | Sts | ROs |
|---|---|---|---|---|---|---|---|---|---|---|---|---|---|---|---|---|---|---|---|---|
| Gosford/Kariong | 1 | 1 | - | 16 | 16 | 16.00 | - | - | - | 8 | 1 | 39 | 1 | 39.00 | 1-39 | - | - | 1 | - | - |
| Warnervale | 1 | 1 | - | 2 | 2 | 2.00 | - | - | - | - | - | - | - | - | - | - | - | - | - | - |
Results by Ground
| Ground | Mat | Inn | NO | Runs | HS | Ave | SR | 100 | 50 | Overs | Maid | RunsA | Wkts | Ave | Best | 10W | 5WI | Cts | Sts | ROs |
|---|---|---|---|---|---|---|---|---|---|---|---|---|---|---|---|---|---|---|---|---|
| Alan Davidson | 1 | 1 | - | 16 | 16 | 16.00 | - | - | - | 8 | 1 | 39 | 1 | 39.00 | 1-39 | - | - | 1 | - | - |
| Blue Haven | 1 | 1 | - | 2 | 2 | 2.00 | - | - | - | - | - | - | - | - | - | - | - | - | - | - |
Stats by Cricket Statz | Last updated 30-Nov-2025.