Lucas Sadler
All Matches, All Grades, Narara, 04-Oct-2025 to 30-Nov-2025
The Var is the variance of the scores to the mean. It is a measure of how reliable the batsman is at reaching their average. A low variance indicates the batsman will often get scores close to his average. A high variance indicates his scores are fairly unpredictable.
| Mat | Cts | ROs | Sts | GFs | GFWon |
|---|---|---|---|---|---|
| 9 | 2 | - | - | - | - |
Results by Season
| Season | Mat | Inn | NO | Runs | HS | Ave | SR | 100 | 50 | Overs | Maid | RunsA | Wkts | Ave | Best | 10W | 5WI | Cts | Sts | ROs |
|---|---|---|---|---|---|---|---|---|---|---|---|---|---|---|---|---|---|---|---|---|
| 2025/26 | 9 | 9 | - | 87 | 53 | 9.67 | - | - | 1 | - | - | - | - | - | - | - | - | 2 | - | - |
Results by Grade
| Grade | Mat | Inn | NO | Runs | HS | Ave | SR | 100 | 50 | Overs | Maid | RunsA | Wkts | Ave | Best | 10W | 5WI | Cts | Sts | ROs |
|---|---|---|---|---|---|---|---|---|---|---|---|---|---|---|---|---|---|---|---|---|
| 5th Grade | 6 | 6 | - | 83 | 53 | 13.83 | - | - | 1 | - | - | - | - | - | - | - | - | - | - | - |
| Masters | 3 | 3 | - | 4 | 3 | 1.33 | - | - | - | - | - | - | - | - | - | - | - | 2 | - | - |
Batting Statistics
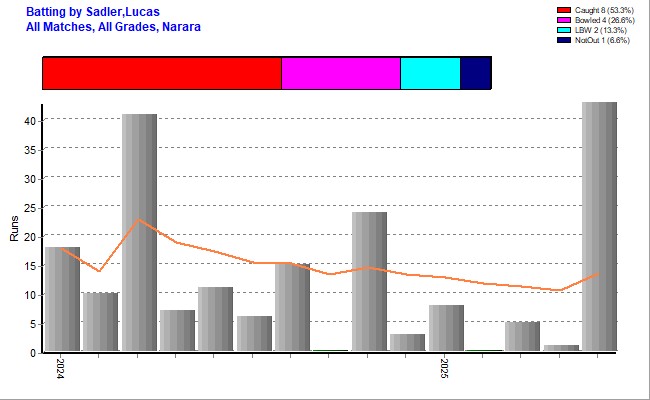
| Inns | NOs | Runs | HS | Ave | Var% | 50s | 100s | 4s | 6s | Ret |
|---|---|---|---|---|---|---|---|---|---|---|
| 9 | - | 87 | 53 Vs TECC 2025/26 | 9.67 | 167.23% | 1 | - | 11 | 1 | - |
Batting Highlights
| Score/s | Team | Vs | Ground | Grade | Date |
|---|---|---|---|---|---|
| 53{lb} | Narara 5th | The Entrance | Alan Davidson | 5th Grade | 25-Oct-2025 |
Results by Batting Position
| Position | Inn | NO | Runs | HS | Ave | SR | 100 | 50 |
|---|---|---|---|---|---|---|---|---|
| Open | 2 | - | 56 | 53 | 28.00 | - | - | 1 |
| 3 | 2 | - | 14 | 14 | 7.00 | - | - | - |
| 4 | 2 | - | 3 | 3 | 1.50 | - | - | - |
| 5 | 2 | - | 13 | 13 | 6.50 | - | - | - |
| 7 | 1 | - | 1 | 1 | 1.00 | - | - | - |
Bowling Statistics
| Overs | Maids | RunsA | Wkts | Best | Ave | 5WI | 10WM |
|---|---|---|---|---|---|---|---|
| - | - | - | - | - | - | - | - |
First Match
| Batting | Bowling | Team | Vs | Ground | Date |
|---|---|---|---|---|---|
| 0{b} | Narara 5th | Warnervale | Alan Davidson | 11-Oct-2025 |
Results by Opposition Team
| Opposition | Mat | Inn | NO | Runs | HS | Ave | SR | 100 | 50 | Overs | Maid | RunsA | Wkts | Ave | Best | 10W | 5WI | Cts | Sts | ROs |
|---|---|---|---|---|---|---|---|---|---|---|---|---|---|---|---|---|---|---|---|---|
| Gosford/Kariong | 1 | 1 | - | 13 | 13 | 13.00 | - | - | - | - | - | - | - | - | - | - | - | - | - | - |
| Kincumber | 2 | 2 | - | - | - | - | - | - | - | - | - | - | - | - | - | - | - | 1 | - | - |
| Lisarow | 1 | 1 | - | 14 | 14 | 14.00 | - | - | - | - | - | - | - | - | - | - | - | - | - | - |
| Southern Spirit | 1 | 1 | - | 3 | 3 | 3.00 | - | - | - | - | - | - | - | - | - | - | - | - | - | - |
| The Entrance | 3 | 3 | - | 57 | 53 | 19.00 | - | - | 1 | - | - | - | - | - | - | - | - | 1 | - | - |
| Warnervale | 1 | 1 | - | - | - | - | - | - | - | - | - | - | - | - | - | - | - | - | - | - |
Results by Ground
| Ground | Mat | Inn | NO | Runs | HS | Ave | SR | 100 | 50 | Overs | Maid | RunsA | Wkts | Ave | Best | 10W | 5WI | Cts | Sts | ROs |
|---|---|---|---|---|---|---|---|---|---|---|---|---|---|---|---|---|---|---|---|---|
| Alan Davidson | 4 | 4 | - | 80 | 53 | 20.00 | - | - | 1 | - | - | - | - | - | - | - | - | - | - | - |
| EDSACC North | 1 | 1 | - | 3 | 3 | 3.00 | - | - | - | - | - | - | - | - | - | - | - | - | - | - |
| Erina | 1 | 1 | - | - | - | - | - | - | - | - | - | - | - | - | - | - | - | 1 | - | - |
| Jubilee Park | 1 | 1 | - | 1 | 1 | 1.00 | - | - | - | - | - | - | - | - | - | - | - | 1 | - | - |
| Paddy Clifton No1 | 1 | 1 | - | - | - | - | - | - | - | - | - | - | - | - | - | - | - | - | - | - |
| Umina #1 | 1 | 1 | - | 3 | 3 | 3.00 | - | - | - | - | - | - | - | - | - | - | - | - | - | - |
Stats by Cricket Statz | Last updated 30-Nov-2025.